Quantcast
Channel: Networking – NetworkGeekStuff
Viewing all 23 articles
Browse latest View live

Playing with the new HP SDN Controller – including getting started guide with Open vSwitch in GNS3

$
0
0

For best article visual quality, open Playing with the new HP SDN Controller – including getting started guide with Open vSwitch in GNS3 directly at NetworkGeekStuff.

So, HP has made one if its significant moves last November (2013) with the first public release of their OpenFlow based SDN VAN Controller 2.0. And because you can download it for free in 60 day trial as an ubuntu package, I wanted to create a nice environment for myself where I can play with it and some OpenFlow enabled switches effectively. This I achieved using the good old GNS3 simulator and importing VirtualBox linux hosts there, one for the SDN controller running on ubuntu system, and several small debian systems running Open vSwitch that will act as OpenFlow SDN switches.

Target solution of this GUIDE:

So lets make this article organized, first what is our target. We want to have two VirtualBox systems ready:

  1. Ubuntu with HP SDN Controller 2.0 installed
  2. Open vSwitch in OpenFlow mode running on debian (controlled by the HP SDN controller)

And we want it all inside GNS3 to be able to play in virtual environment anytime. The two cisco router are actually only simulating end PCs in this particular case, but can also be routers in a more complex SDN environment.

HP SDN Controller and Open vSwitch in GNS3 lab topology

HP SDN Controller and Open vSwitch in GNS3 lab topology

Part I. Installing HP VAN SDN Controller 2.0 on ubuntu 12.04 LTS

The HP VAN SDN Ccontroller 2.0 is a new initiative from HP to create an open ecosystem for SDN networks. The controller supports some basic functions like doing L2 switching or L3 routing, but with open API (REST API) and programming interface in Java, anyone can build an application on top of this controller for any additional functionality (firewall/load-balancer/cloud interface).

HP SDN Ecosystem
HP SDN Ecosystem

To be honest with HP there is a room for scepticism if this ecosystem gets beyound critical point to become popular. BUT at least it is an OPEN solution in sharp contrast to the currently released Cisco ACI (Application Centric Infrastructure), which is basically the SDN idea, but completelly locked to Cisco proprietary environment/protocols and only supporting the new high end Nexus 9000. So I personally would rather have an SDN network based on OpenFlow where I can replace underlining switches and controller with anything I want (even open source) instead of being locked with Cisco.

Additionally you can download this HP Controller from HP here (you will also get example Java App with the package) for installation, administration, and other documentation, here are the links:

HP VAN SDN Controller Installation Guide:
http://h20564.www2.hp.com/portal/site/hpsc/public/kb/docDisplay/?docId=c03998700

HP VAN SDN Controller License Registration and Activation Guide:
http://h20564.www2.hp.com/portal/site/hpsc/public/kb/docDisplay/?docId=c03995716

HP VAN SDN Controller Administrator Guide:
http://h20564.www2.hp.com/portal/site/hpsc/public/kb/docDisplay/?docId=c04003114

SDN Controller Programming Guide:
http://h20564.www2.hp.com/portal/site/hpsc/public/kb/docDisplay/?docId=c04003169

HP VAN SDN Controller Open Source and Third-Party Software License Agreements:
http://h20564.www2.hp.com/portal/site/hpsc/public/kb/docDisplay/?docId=c04003602

HP VAN SDN Controller REST API Guide:
http://h20564.www2.hp.com/portal/site/hpsc/public/kb/docDisplay/?docId=c04003972

Step 1 – Download HP VAN SDN Controller 2.0

First question that I will answer is why using ubuntu, it is because the HP SDN Controller is not really yet so flexibile to work without issues on other distributions. Believe me because I tried first on Debian and I spent 4 hours troubleshooting dependencies on various packages (mostly because the developers chosen most newer versions of packages even beyond testing branch). So I really recommend you simply install ubuntu 12.04 and then follow the HP SDN Controller Installation Guide (backup link) absolutely step by step.

NOTE: Including the part of using the ubuntu cloud repository and definitely use the recommended Java 7 update 25 on your computer (the one where you want to use the GUI) because other Java systems will simply not work!

Step 2 – Install the HP VAN SDN Controller 2.0

So only to summarize what you need to do from the Installation Guide:

First prepare the repository and background system:

root@hpsdncontroller:~# apt-get install python-software-properties ubuntu-cloud-keyring
root@hpsdncontroller:~# add-apt-repository “deb http://ubuntu-cloud.archive.canonical.com/ubuntu precise-updates/folsom main”
root@hpsdncontroller:~# apt-get update
root@hpsdncontroller:~# apt-get install openjdk-7-jre-headless postgresql keystone keystone-doc python-keystone iptables unzip

Then we install the HP SDN controller package itself

root@hpsdncontroller:~# dpkg -i hp-sdn-ctl_2.0.1.4254_amd64.deb

And it is best that we check the installation

root@hpsdncontroller:~# dpkg -l hp-sdn-ctl
Desired=Unknown/Install/Remove/Purge/Hold
| Status=Not/Inst/Conf-files/Unpacked/halF-conf/Half-inst/trig-aWait/Trig-pend
|/ Err?=(none)/Reinst-required (Status,Err: uppercase=bad)
||/ Name                   Version                Description
+++-======================-======================-=============================
ii  hp-sdn-ctl             2.0.0.4253             HP VAN SDN Controller

Then we can check if the service is running be either checking the process status, or we can check if there is a Java daemon on TCP 8773 port.

root@hpsdncontroller:~# service sdnc status
sdnc start/running, process 1000
root@hpsdncontroller:~# netstat -atupvn | grep 8443
tcp6       0      0 :::8443                 :::*                    LISTEN      1045/java

Step 3 – Login and license activation of the HP VAN SDN Controller 2.0

And finally, we can login to the SDN controller on https://localhost:8443/sdn/ui/ , the username is sdn and password is skyline.

SDN Login Screen

SDN Login Screen

Once you login, the basic GUI view is very simple (and quite empty at the beginning).

HP SDN Controller Main GUI View

HP SDN Controller Main GUI View

The last point is getting a license for your installation,actually the best way is to go for HP VAN SDN Controller License Registration and Activation Guide.

This is the part that actually sux for me, but it was possible in summary using these commands:

First we install curl to ubuntu.

apt-get install curl

Then we ask our controller (running on 192.168.10.145 in my case) for “token”.

curl -sk -H 'Content-Type:application/json' -d '{"login":{"user":"sdn","password":"skyline","domain":"sdn"}}' https://192.168.10.145:8443/sdn/v2.0/auth
{"record":{"token":"4cd8d740fa9c4155b3c541a4c549bdf1","expiration":1385223997000,"expirationDate":"2013-11-23 17-26-37 +0100","userId":"a1759368553542bdae4bea4e7a17a5ff","userName":"sdn","domainId":"0eaae105e0b5445f912f7d698bdbb79b","domainName":"sdn"}}

With the token we ask for install ID that we need for license

curl -sk -H "X-Auth-Token:4cd8d740fa9c4155b3c541a4c549bdf1" https://192.168.10.145:8443/sdn/v2.0/licenses/installid
14751537

Now, this is the bad part guys, the licenses are pay walled :(. If I find a way how to get it free (I have it as HP employee), I will update this part.

With the install ID and token, you have to go to HP My Networking and find your order on the page visible below:

HP-Networking Order Search

HP-Networking Order Search

REMARK: The HP SDN controller is a paid product, but for HP employees (as I am). For anyone else, there is a link on the HP SDN Controller homepage for a 60 day trial, but I haven’t tried it myself to get the license this way. So sorry that I cannot help more, by you will have to get a license yourself somehow.

From the License process, you should recieve something like this basedon you license and the install ID, here is mine:

License Key(s)

License key: AECBMHD2DJPQU-NJTFY7C2NBTOB-6VM4QKEQ5SOEI-DAUHQELRPGYFA
Registration ID: T2HBKKX-2MBG3Y3-P6DRQMG-WQ8GKWT
Product number: J9863AAE
Product name: HP VAN SDN Ctrl Base SW w/ 50-node E-LTU
License quantity: 1
Install ID: 14751537
Status: Active
Activation date: 03-Dec-2013
Expiration date: 01-Feb-2014
Friendly name: hpsdncontroller
Customer notes: HP SDN Controller for LAB purposes

The above keys are not valid anymore as I used them, so do not try to use them 😉

Activating a license on the HP SDN Controller

root@hpsdncontroller:~# curl -sk -H 'Content-Type:application/json' -d '{"login":{"user":"sdn","password":"skyline","domain":"sdn"}}' https://192.168.10.145:8443/sdn/v2.0/auth
{"record":{"token":"949ec3ddae9a4afcbf4c5511c10a7c5e","expiration":1386153820000,
"expirationDate":"2013-12-04 11-43-40 +0100","userId":"a1759368553542bdae4bea4e7a17a5ff",
"userName":"sdn","domainId":"0eaae105e0b5445f912f7d698bdbb79

We take the token from Authentication, and use it for license insertion to the controller.

root@hpsdncontroller:~# curl -sk -H "X-Auth-Token:949ec3ddae9a4afcbf4c5511c10a7c5e" --data-ascii AECBMHD2DJPQU-NJTFY7C2NBTOB-6VM4QKEQ5SOEI-DAUHQELRPGYFA https://192.168.10.145:8443/sdn/v2.0/licenses
{
  "license" : {
    "install_id" : 14751537,
    "serial_no" : 26,
    "license_metric" : "Controller Node",
    "product" : "HP VAN SDN Ctrl Base",
    "metric_qty" : 50,
    "license_type" : "TRIAL",
    "base_license" : true,
    "creation_date" : "2013-12-03T11:46:26.484Z",
    "activated_date" : "2013-12-03T11:46:26.484Z",
    "expiry_date" : "2014-02-01T11:46:26.484Z",
    "license_status" : "ACTIVE"
  }
}

You can check in the controller GUI in the Audit LOG that the new license was added as visible below:

SDN License in Audit Log

SDN License in Audit Log

Part II. Installing Open vSwitch on debian host

Here is a quick guide how to compile and install an Open vSwitch kernel module in OpenFLow mode. We will use this vSwitch daemon and install it on minimalistic debian to create for us a nice SDN switch usable in GNS3.

Step 1 – Download Open vSwitch

First, if you need more information about this great piece of software, visit the vSwitch homepage at http://openvswitch.org/. In this lab, I used vSwitch version 1.9.3 which you can download in official repositories here – openvswitch-1.9.3.tar.gz  (backup link)

Step 2 – unpack, compile, install and first start

So, first lets unpack the openvswitch tar with tar -xvf ./openvswitch-1.9.3.tar.gz

tar -xvf ./openvswitch-1.9.3.tar.gz

Next, enter the directory (I recommend that you read the INSTALL files, which I admit most of this vSwitch installation is based on).

root@minidebian:~# cd vSwitch/install/openvswitch-1.9.3
root@minidebian:~/vSwitch/install/openvswitch-1.9.3# ./configure
... OMITTED ...

I have omitted the output as it is a very long and boring one, but make sure there are no errors in your execution. The configure script is technically checking if you have all the libraries and compilation tools needed in your system, if something essential will be missing, it will stop and exit wit error that you must solve to continue!

root@minidebian:~/vSwitch/install/openvswitch-1.9.3# make
... OMITTED ...

Now if you haven’t used root for the previous commands, for this last one you have to become root or used su command. The last command is make install that will move all the compiled vSwitch binaries to correct places in the system.

root@minidebian:~/vSwitch/install/openvswitch-1.9.3# make  install
... OMITTED ...

Then, create a folder for vSwitch database and initialize the database.

mkdir -p /usr/local/etc/openvswitch
ovsdb-tool create /usr/local/etc/openvswitch/conf.db vswitchd/vswitch.ovsschema

Then we can start the vSwitch database deamon that is called ovsdb-server.

/usr/local/sbin/ovsdb-server --detach --remote=punix:/usr/local/var/run/openvswitch/db.sock --remote=db:Open_vSwitch,manager_options --pidfile

Following the database start, you can start the main vSwitch daemon itself called ovs-vswitchd.

/usr/local/sbin/ovs-vswitchd --pidfile --detach

Step 3 – Local vSwitch configuration (interfaces and controller connect)

You have the vSwitch up and running now, but with empty configuration. What we need is to create a basic port configurations (add physical interfaces to be controlled by Open vSwitch in OpenFlow mode) and then tell the switch where the controller is located.

In my example, my system has 4 ethernet interfaces that I will configure this way:
eth4 – this interface will not be touched by the vSwitch and will be used by classical linux system to allow communication between the vSwitch and the controller.
eth5, eth6, eth7 – these three interfaces will be used for connecting to other GNS3 switches/routers/hosts.

This is how I will configure it, first let’s create a virtual switch called ofbr0.

root@minidebian:~# ovs-vsctl add-br ofbr0
root@minidebian:~# ovs-vsctl add-port ofbr0 eth5
root@minidebian:~# ovs-vsctl add-port ofbr0 eth6
root@minidebian:~# ovs-vsctl add-port ofbr0 eth7
root@minidebian:~# ifconfig eth5 promisc up
root@minidebian:~# ifconfig eth6 promisc up
root@minidebian:~# ifconfig eth7 promisc up

You can then check the interface status by your vSwitch with the ovs-ofctl show ofbr0 command as shown below (the ovs-ofctl is your main interface to talk with the OpenFlow vSwitch implementation).

root@minidebian:~# ovs-ofctl show ofbr0
OFPT_FEATURES_REPLY (xid=0x1): dpid:000008002723fef6
n_tables:255, n_buffers:256
capabilities: FLOW_STATS TABLE_STATS PORT_STATS QUEUE_STATS ARP_MATCH_IP
actions: OUTPUT SET_VLAN_VID SET_VLAN_PCP STRIP_VLAN SET_DL_SRC SET_DL_DST SET_NW_SRC SET_NW_DST SET_NW_TOS SET_TP_SRC SET_TP_DST ENQUEUE
 1(eth6): addr:08:00:27:bb:1d:8a
     config:     0
     state:      0
     current:    1GB-FD COPPER AUTO_NEG
     advertised: 10MB-HD 10MB-FD 100MB-HD 100MB-FD 1GB-FD COPPER AUTO_NEG
     supported:  10MB-HD 10MB-FD 100MB-HD 100MB-FD 1GB-FD COPPER AUTO_NEG
     speed: 1000 Mbps now, 1000 Mbps max
 2(eth7): addr:08:00:27:d0:44:aa
     config:     0
     state:      LINK_DOWN
     current:    COPPER AUTO_NEG
     advertised: 10MB-HD 10MB-FD 100MB-HD 100MB-FD 1GB-FD COPPER AUTO_NEG
     supported:  10MB-HD 10MB-FD 100MB-HD 100MB-FD 1GB-FD COPPER AUTO_NEG
     speed: 100 Mbps now, 1000 Mbps max
 3(eth5): addr:08:00:27:23:fe:f6
     config:     0
     state:      0
     current:    1GB-FD COPPER AUTO_NEG
     advertised: 10MB-HD 10MB-FD 100MB-HD 100MB-FD 1GB-FD COPPER AUTO_NEG
     supported:  10MB-HD 10MB-FD 100MB-HD 100MB-FD 1GB-FD COPPER AUTO_NEG
     speed: 1000 Mbps now, 1000 Mbps max
 LOCAL(ofbr0): addr:08:00:27:23:fe:f6
     config:     PORT_DOWN
     state:      LINK_DOWN
     speed: 100 Mbps now, 100 Mbps max
OFPT_GET_CONFIG_REPLY (xid=0x3): frags=normal miss_send_len=0

Other interesting commands to note for the future are:

# interface status:
ovs-ofctl show ofbr0

# show the flow table:
ovs-ofctl dump-flows ofbr0

Then you need to configure the controller IP and port where the vSwitch will try to connect and be controlled from. This is a simple ovs-vsctl set-controller ofbr0 tcp:X.X.X.X:port.

root@minidebian:~# ovs-vsctl set-controller ofbr0 tcp:192.168.10.145:6633
root@minidebian:~# ovs-vsctl get-controller ofbr0   
tcp:192.168.10.145:6633

To verify that you correctly configured the controller, vSwitch ports and the communication between the controller and the vSwitch is working, go to the HP SDN controller GUI and open the OpenFlow Monitor. Inside you should see your switch registered (my vSwitch has 192.168.10.148).

vSwitch registered to HP SDN controller

vSwitch registered to HP SDN controller

You can also check the ports inside the HP SDN controller by selecting the switch and clicking on “Ports”.

vSwitch registered to HP SDN controller - Ports

vSwitch registered to HP SDN controller – Ports


Part III. Building the topology and testing traffic forwarding

Ok, so we have both the controller and the Open vSwitch, lets put them both to GNS3 and try to interconnect them.

Step 1 – clone your virtual vSwitch system to have more switches for topology.

In VirtualBox (and also vmWare), you can clone the virtual system and create an identical copies. Do this with network MAC address re-initialization to create a unique set of interfaces in each system and create three vSwitches. Then add them to your GNS3 LAB topology via VBox API.

Step 2 – add all three vSwitch systems and the HP SDN controller system to GNS 3

Create the GNS3 topology, you can create your own design, my image below is simply an example.

GNS3 topology with three cloned vSwitch systems

GNS3 topology with three cloned vSwitch systems

In my topology, these are the system IPs in the background:

192.168.10.145 – HP SDN controller
192.168.10.148 – vSwitch 1 (original vSwitch with eth4, eth5, eth6, eth7)
192.168.10.156 and 192.168.10.159 are the clones, with eth8, eth9, eth10 and eth11 interfaces (after re-initialization)

Configure all three vSwitches to connect to the HP SDN controller and to use the needed ports in the virtual switch instance just as I showed in Part II. Then you can check the HP SDN controller is seeing the switches.

HP SDN Controller view on three switches

HP SDN Controller view on three switches

Step 3 – Testing the forwarding capabilities

Ok, guys, now the magic part. Have a look to the “OpenFlow Topology” view and you will notice that there is already a small map of our lab topology there.

HP SDN Controller - topology view on three switches in GNS3 lab

HP SDN Controller – topology view on three switches in GNS3 lab

Now, lets start the two GNS routers that simulate an end host systems:

GNS3 - start routers that simulate end hosts

GNS3 – start routers that simulate end hosts

Next, configure both routers with their IP addresses (inside same subnet). This is trivial and I am only showing this for completeness if this article is being red by non-network technician.

GNS3 - configure a router with IP address

GNS3 – configure a router with IP address

Once this is done, you can again check the SDN Controller if it already registered the two hosts in the Topology view, correctly you should already see something like this:

HP SDN Controller - OpenFlow Topology - three switches and two cisco routers visible as hosts

HP SDN Controller – OpenFlow Topology – three switches and two cisco routers visible as hosts

Now you should be able to nicely ping between the two routers because the HP SDN Controller would run Dijkstra algorithm to find a path through the network. So lets try the ping between our two hosts.

GNS3 ping between two routers in SDN topology

GNS3 ping between two routers in SDN topology

To see the Dijkstra algorithm path from the HP SDN Controller point of view, the Topology Overview provides a feature to switch the nodes view from mac-address to IP and to simulate the traffic path by selecting source/destination on the nodes, the results of this is visible below.

HP SDN Controller visualizing the path between two nodes in our lab topology

HP SDN Controller visualizing the path between two nodes in our lab topology

Lets examine the Flow Table on one of the switches, lets select the 00:00:08:00:27:0c:5e:0e (192.168.10.156) switch. You can do this inside the vSwitch console for a most extensive output:

root@minidebian:~# ovs-ofctl dump-flows ofbr0
NXST_FLOW reply (xid=0x4):
 cookie=0x2328, duration=5.364s, table=0, n_packets=5, n_bytes=570, idle_timeout=60, idle_age=5, priority=29999,ip,in_port=5,dl_src=cc:01:37:04:45:14,dl_dst=cc:00:16:20:00:00 actions=output:3
 cookie=0x2328, duration=5.3s, table=0, n_packets=4, n_bytes=456, idle_timeout=60, idle_age=5, priority=29999,ip,in_port=3,dl_src=cc:00:16:20:00:00,dl_dst=cc:01:37:04:45:14 actions=output:5

Or you can also ask the HP SDN Controller via the OpenFlow Monitor menu as shown below:

HP SDN Controller - Flow Table on vSwitch

HP SDN Controller – Flow Table on vSwitch

Summary

In the very end I must say that the L2 functionality that is in the core of the release the SDN seems to work. I also played with some outages and will try to move from virtual GNS3 lab to a physical lab utilizing some HP switches that have OpenFlow support already. But the biggest lack currently with the HP SDN Controller is a simple lack of more applications on top of the controller. For example the is not even yet any L3 router, not to mention firewall or  load-balancer. Hopefully this will all change when the SDN app store will be opened. There are already some partner companies developing more applications on top of the HP SDN Controller, but I haven’t seen yet any reall product that would make the HP SDN really applicable in a production environment.

Right now, this SDN from HP as vendor is only usable in lab environment and for basic L2 switching, it you want to develop your own applications you can already to so using the provided java JDK and API, but I believe 99% off all people readying this are interested in deploying SDN as a complete solution, and do not have the time/resources to develop custom SDN right now (like google did).  So it is a waiting game with SDN in labs for most of us (including me), but the future for datacenters definitely looks interesting with many SDN companies trying to enter the marked.

PS: Just as a quick remark that much more is happening inside HP and the SDN/Cloud is the interesting project inside HP that is called the HP Public Cloud – www.hpcloud.com, which is actually a whole Cloud (similar to amazon or oracle cloud) on top of SDN/OpenStack, but using custom controller really. And with the new user panel called Horizon, it allows you to quickly spawn and Infrastructure as a Service (IaaS) including networks, routers, servers and currently a load-balancer in beta (firewall filtering is internal mechanism so no dedicated firewall needed). Some pictures below for inspiration how I was playing there in a free 90 days trial.

www.hpcloud.com - creating a virtual server

www.hpcloud.com – creating a virtual server

hpcloud.com_virtual_network

www.hpcloud.com – creating a virtual network with multiple subnets and virtual router


[minipost] How to fix MySQL lost table description from .frm files after emergency migration of /var/lib/mysql

$
0
0

For best article visual quality, open [minipost] How to fix MySQL lost table description from .frm files after emergency migration of /var/lib/mysql directly at NetworkGeekStuff.

TuxTIP_mergedIn May 2014, networkgeekstuff.com got a small problem when the hosting BeagleBone Black went dead and the old Raspberry PI environment was on that point already used for another project. I was forced to migrate quickly to a virtual server hosting company that I use. Actually it was a performance boost and quick quick, my MySQL and Apache migration scripts for backup recovery made the transition in ~2 hours. But last week I noticed that my MySQL backup system had troubles with two WordPress tables.


The MySQLdump was telling me that two tables do not exist with this message:

root@gserver:~/scripts/tachicoma_remote_backup# mysqldump -h localhost -u mysqlbackuper -p<removed> wordpressikdata > wordpressikdata.sql
mysqldump: Got error: 1146: Table ‘wordpressikdata.wp_rfr2b_options‘ doesn’t exist when using LOCK TABLES

root@gserver:~/scripts/tachicoma_remote_backup# mysqldump -h localhost -u mysqlbackuper -p<removed> wordpressikdata > wordpressikdata.sql
mysqldump: Got error: 1146: Table ‘wordpressikdata.wp_rfr2b_options‘ doesn’t exist when using LOCK TABLES

But when I looked at /var/lib/mysql/wordpressikdata, the files for these tables are there, and show tables showed these tables as well.

mysql> show tables;
+----------------------------+
| Tables_in_wordpressikdata  |
+----------------------------+
| wp_commentmeta             |
| wp_comments                |
| wp_gallery_galleries       |
| wp_gallery_galleriesslides |
| wp_gallery_slides          |
| wp_links                   |
| wp_options                 |
| wp_postmeta                |
| wp_posts                   |
| wp_rfr2b_options           |
| wp_rfr2b_target            |
| wp_term_relationships      |
| wp_term_taxonomy           |
| wp_terms                   |
| wp_usermeta                |
| wp_users                   |
+----------------------------+
16 rows in set (0.00 sec)

The first clue that something is wrong provided only mysqlcheck….

networkgeek@testserver:~$ mysqlcheck -u root -p wordpressikdata              
Enter password:
wordpressikdata.wp_commentmeta                     OK
wordpressikdata.wp_comments                        OK
wordpressikdata.wp_gallery_galleries               OK
wordpressikdata.wp_gallery_galleriesslides         OK
wordpressikdata.wp_gallery_slides                  OK
wordpressikdata.wp_links                           OK
wordpressikdata.wp_options                         OK
wordpressikdata.wp_postmeta                        OK
wordpressikdata.wp_posts                           OK
wordpressikdata.wp_rfr2b_options
Error    : Table 'wordpressikdata.wp_rfr2b_options' doesn't exist
status   : Operation failed
wordpressikdata.wp_rfr2b_target
Error    : Table 'wordpressikdata.wp_rfr2b_target' doesn't exist
status   : Operation failed
wordpressikdata.wp_term_relationships              OK
wordpressikdata.wp_term_taxonomy                   OK
wordpressikdata.wp_terms                           OK
wordpressikdata.wp_usermeta                        OK
wordpressikdata.wp_users                           OK

Also if you tried to get a table desciption from mysql with mysql> description wp_rfr2b_options; … it would fail

So how to fix this? My only files that I had were these two:
wp_rfr2b_options.frm
wp_rfr2b_target.frm
… but these are binary and we need to find their description to again define and insert these tables to MySQL

Luckly for us, there exists a utility from MySQL called mysqlfrm that can read the binary files and give you the needed CREATE TABLE commands for MySQL automatically. On Debian (you need to be debian testing branch when this was written in Jun 2014) you can install mysql-utilities package to get this tool. Then simply use it like this on the file:

root@testserver:~/recovery# mysqlfrm --diagnostic ./wp_rfr2b_
wp_rfr2b_options.frm  wp_rfr2b_target.frm
root@minidebian:~/recovery# mysqlfrm --diagnostic ./wp_rfr2b_target.frm
# WARNING: Cannot generate character set or collation names without the --server option.
# CAUTION: The diagnostic mode is a best-effort parse of the .frm file. As such, it may not identify all of the components of the table correctly. This is especially true for damaged files. It will also not read the default values for the columns and the resulting statement may not be syntactically correct.
# Reading .frm file for ./wp_rfr2b_target.frm:
# The .frm file is a TABLE.
# CREATE TABLE Statement:

CREATE TABLE `wp_rfr2b_target` (
  `id` int(11) NOT NULL AUTO_INCREMENT,
  `rss_content` text CHARACTER SET <UNKNOWN>,
  `rss_ad_campaign_name` varchar(300) CHARACTER SET <UNKNOWN> NOT NULL,
  `optin_fields` text CHARACTER SET <UNKNOWN>,
  `rss_extra` text CHARACTER SET <UNKNOWN>,
  `flag_ad_campaign` enum('0','1') CHARACTER SET <UNKNOWN> NOT NULL,
PRIMARY KEY `PRIMARY` (`id`)
) ENGINE=InnoDB;

#...done.

The system had a little problem to identify the character set, but you can simply delete these parts if you know (like I do) that your default MySQL character set is good enough (like UTF8). In the end, after some manual modification, I had my tables definitions.

CREATE TABLE `wordpressikdata`.`wp_rfr2b_options` (
  `option_name` varchar(750),
  `option_value` text,
PRIMARY KEY `PRIMARY` (`option_name`)
) ENGINE=InnoDB;

CREATE TABLE `wordpressikdata`.`wp_rfr2b_target` (
  `id` int(11) NOT NULL AUTO_INCREMENT,
  `rss_content` text,
  `rss_ad_campaign_name` varchar(300),
  `optin_fields` text,
  `rss_extra` text,
  `flag_ad_campaign` enum('0','1'),
PRIMARY KEY `PRIMARY` (`id`)
) ENGINE=InnoDB;

In summary, hopefully this will help someone. For me this is a self-documentation really as this issue today took me a few hours to investigate and find a solution, hopefully it will save some time to any of you guys out there.


[minipost] Mikrotik/RouterBoard port-knocking example for firewall/NAT openings

$
0
0

For best article visual quality, open [minipost] Mikrotik/RouterBoard port-knocking example for firewall/NAT openings directly at NetworkGeekStuff.

The situation is very simple, you are away from home (imagine visiting a friend or being at work), but you desperately would like to access your internal LAN FTP/Samba/etc… , but you do not have with you your own notebook or any device with a VPN capability to tunnel to your home securely. So what to do ? You do not really want to open your home firewall and NAT whole internet to the internal PC or server on your LAN. Lucky for you, there exists a trick under a name of “port-knocking” where you can send to your home firewall a sequence of TCP or UDP packets with specific ports (the ports act as a password) and your home system can temporarily open the firewall and NAT to only your source IP from which these packets arrived. In this quick example I will show you how to do this on Mikrotik (where I do this for several years now) and I will point you to generic linux tutorial for the same using iptables in links below.

Main Example

Target: I want to access my home linux server for SSH and more importantly SFTP, which is running on LAN with IP 192.168.10.129. Port-Knocking sequence I want: 547, 879 and 47 in TCP packets will open the access.
Extra restriction: After successful port-knocking, only allow access for new SSH/SFTP sessions for 15min, but do not break established session until it disconnects itself normally.

To put this down to a diagram, this is what I want:

Mikrotik allowing access to internal server if you port-knock

Mikrotik allowing access to internal server if you port-knock

Implementation, is quite simple and I will split it to few steps.

Pre-requisites: I assume you already have you Mikrotik router configured with basic routing and firewall logic and that you already have your public IP on the internet where you can capture the port-knocking sequence. In my example, my public IP will be 89.173.230.17. You can get yours from the /ip address print command as visible below:

[zerxen_lord@Arachnid] /> /ip address print 
Flags: X - disabled, I - invalid, D - dynamic 
 #   ADDRESS            NETWORK         INTERFACE
 0   192.168.10.130/26  192.168.10.128  GameBridge
 1 D 89.173.230.17/21    89.173.224.0   ether1

Step 1, create the firewall rule and NAT rule

/ip firewall nat add chain=dstnat action=dst-nat to-addresses=192.168.10.129 to-ports=22 protocol=tcp src-address-list=PORTKNOCK_ALLOWED in-interface=ether1 dst-port=2222
/ip firewall filter add chain=input action=accept connection-state=new protocol=tcp src-address-list=PORTKNOCK_ALLOWED in-interface=ether1 dst-port=2222
/ip firewall filter add chain=input action=accept connection-state=established

Explanation is that this NAT rule and firewall rule only works for source IPs (the IP X in our example) that are part of the PORTKNOCK_ALLOWED list. Also note that I moved the NAT to allow TCP 2222 as an alternative to using the native 22 which is reserved for the router itself, so when I will connect to the internal server from internet, I will use the port 2222.

Step 2, create a group of firewall rules that generate a temporary PORTKNOCK_ALLOWED list

/ip firewall filter add chain=input action=add-src-to-address-list connection-state=new protocol=udp \
     src-address-list=PORTKNOCK_STAGE_2 address-list=PORTKNOCK_ALLOWED address-list-timeout=15m \
     in-interface=ether1 dst-port=47

/ip firewall filter add chain=input action=add-src-to-address-list connection-state=new protocol=udp \
     src-address-list=PORTKNOCK_STAGE_1 address-list=PORTKNOCK_STAGE_2 address-list-timeout=20s \
     in-interface=ether1 dst-port=879

/ip firewall filter add chain=input action=add-src-to-address-list connection-state=new protocol=udp \
     address-list=PORTKNOCK_STAGE_1 address-list-timeout=20s in-interface=ether1 dst-port=547 \

Explanation is that you need three rules in a reverse order adding the IP X to a list. When the first UDP 547 arrives, the 3rd rule will put it to PORTKNOCK_STAGE_1. When the next UDP 879 arrives and it is already in PORTKNOCK_STAGE_1, it will be put also to PORTKNOCK_2. WHen the last UDP 47 arrives and the IP X is already in PORTKNOCK_2, it is added to PORTKNOCK_ALLOWED for 15minutes (you can notice the previous stages only have 20seconds timeout).

Step 3, port-knock wither with portknock client, or telnet command

So we are finished, not only you need to test it. Technically the only thing you need to do now is to open windows command console (Start->type “cmd” and enter). In this console use the command “telnet” to one by one send the packets as needed by portknocking like this:

telnet 89.173.230.17 547
telnet 89.173.230.17 879
telnet 89.173.230.17 47

 NOTE: if you are using windows 7, you have to manually activate telnet in the windows components, just google this part, there are just too many guides for this out there.

Then we can have a look to see if the source IP is inside all the source-lists with /

[zerxen_lord@Arachnid] > /ip firewall address-list print
Flags: X - disabled, D - dynamic
 #   LIST                                                                      ADDRESS
 0 D PORTKNOCK_STAGE_1                                                   176.56.236.140
 1 D PORTKNOCK_STAGE_2                                                   176.56.236.140
 2 D PORTKNOCK_ALLOWED                                                   176.56.236.140

Now there are alternatives to the telnet command of course, but knowing telnet is a good backup. I personally use on linux the basic NetCat command nc, which you can put down to a quick script to do your port-knocking for you like here:

nc -u -z 89.173.230.17 547 -w 1
nc -u -z 89.173.230.17 879 -w 1
nc -u -z 89.173.230.17 47 -w 1

There also exist port-knockers for windows with identical functions, but I will leave to you to find one that suits your needs. I also use a port-knocker on my iPhone called KnockOnD, so you can imagine how relatively easy and wide-spread the port-knocking is.

PS: The public IPs used in this example are random IPs, I didn’t published here my real IPs 😉 Just FYI.

Introduction and LAB tutorial of HP Helion Community Edition, the OpenStack based “cloud” system that can give you a personal cloud!

$
0
0

For best article visual quality, open Introduction and LAB tutorial of HP Helion Community Edition, the OpenStack based “cloud” system that can give you a personal cloud! directly at NetworkGeekStuff.

Hewlett-Packard (HP) is a long enterprise  supporter of cloud technologies and early this year, they released publicly HP Helion Community Edition (CE). HP Helion is HP’s OpenStack based cloud system with which HP plans to provide value added services (both in sense of software and service) with the upcoming release of HP Helion Enterprise edition later this year. In this article, I plan to introduce you to the HP Helion CE, quickly guide you through the installation, basic operations and in the end get you a quick view on the OpenStack architecture in general.

HP and “clouds”

HPCloud

For a long time HP has been providing cloud solution based on their internal Cloud Service Automation or “CSA” system to enterprise grade customers as part of their portfolio. I had access to several projects using this environment and although I still have mixed feelings about their effectiveness, they were a step in the right direction as classical (now called “legacy”) data-centers are loosing popularity to cloud and other automated systems.  The newest approach HP has taken however appears to be even better than anything in their current enterprise portfolio and the biggest honeypot is integration of OpenStack to a HP system called “HP Helion”.

For those who do not know OpenStack, it is an open source project that is uniting right now most of the datacenter automation efforts for control and provisioning of networking/storage/computing (means servers) under one GUI covered logic. My more elemental explanation, which I am giving to people, is that OpenStack is trying to put together all the independent automation work that both bigger and smaller companies providing virtual servers have been doing internally and standardizing it. To get some quick and practical touch of OpenStack, I encourage you to either install one of the prepared distros like Cloudbuntu (ubuntu with openstack integrated) or go to openstack.org and try to integrate openstack natively to the linux/unix of your choice. Just note that OpenStack is a provisioning system designed to run on multiple servers, so expect that if you want to run in only on your one PC, you will have to play with wmvare or virtualbox to give openstack at least minimal architecture (with 4 servers) it needs.

HP Helion is a integration layer of added value software, streamlined installation and also optional enterprise support license on top of OpenStack cloud system. Technically HP wants to give out their own “flavour” of OpenStack and sell support service. Also HPs internal enterprise organizations that are providing both dedicated or leveraged cloud services to enterprise customers are now working on adopting HP Helion with their older Cloud Service Automation 4.0 (CSA 4.0) because OpenStack provides many things (like network gui) that CSA didn’t had. To get a feeling about HP Helion operations you can do two independent things depending on your free time.

Option 1: go to hpcloud.com and get a 90 day trial of their cloud services. This is similar to the amazon cloud service in that you can very quickly get a virtual server from HP, get a public IP for it and just play. The big advantage here is the gui that enables you not only to get a server, but to actually get a full network topology around it.

Option 2: Download HP Helion community edition and install it in a lab. This is the option we will now pursue for the rest of this article. The community edition exists because OpenStack is an open source software so HP doesn’t own it and has to release a open source version of any derivative work they want to do.

Installing HP Helion community edition

First, the prerequisites for HP Helion are officialy:

  • At least 16 GB of RAM
  • At least 200 GB of available disk space (although really the install will take around 80GB, so if you have around 140GB free to have something free also for VMs, you are OK)
  • Virtualization support enabled in the BIOS

NOTE: I originally didn’t had 16GB of RAM, so I somehow managed to find most virtual machines definitions of RAM and lower it, but the system is then using swap area like crazy and essentially rendered the installation unusable. If you really try to push it to run on less than 16GB of RAM it is possible, but at least try to use an SSD disk for it as otherwise you will loose your nerves here.

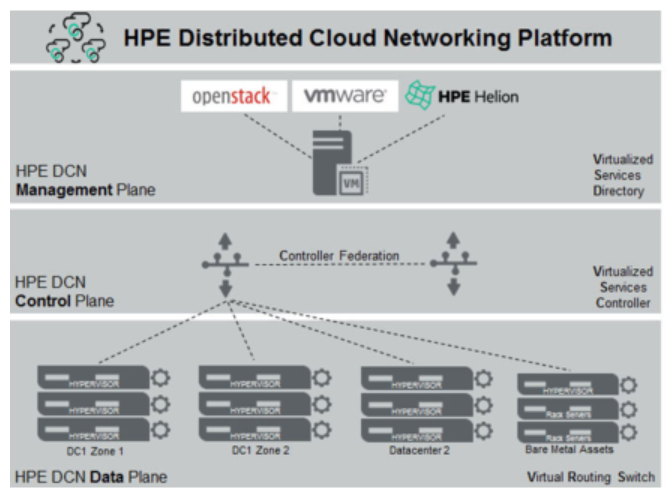
Target architecture of virtual-in-virtual HP Helion CE

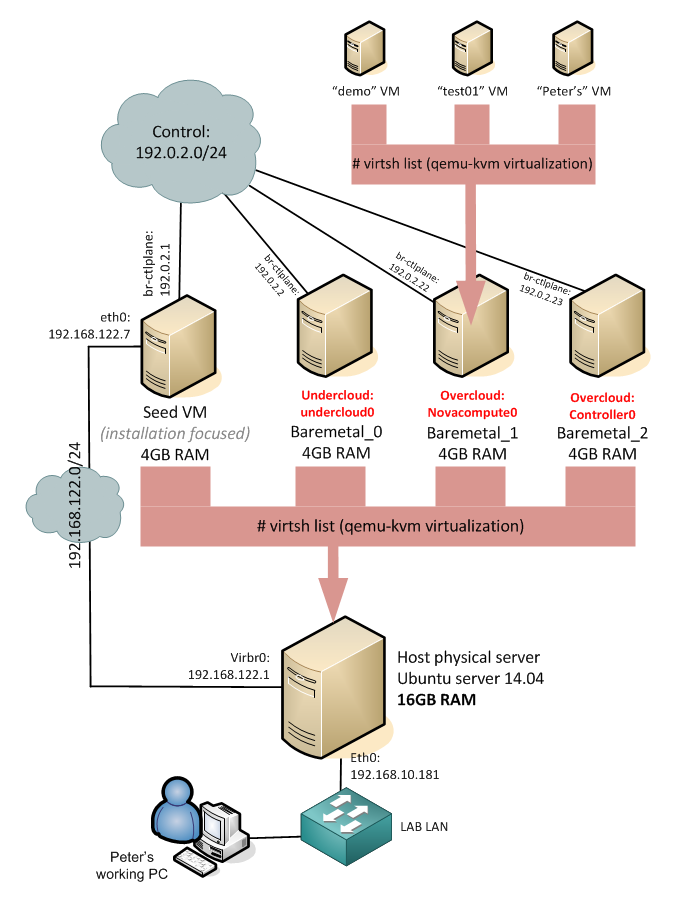
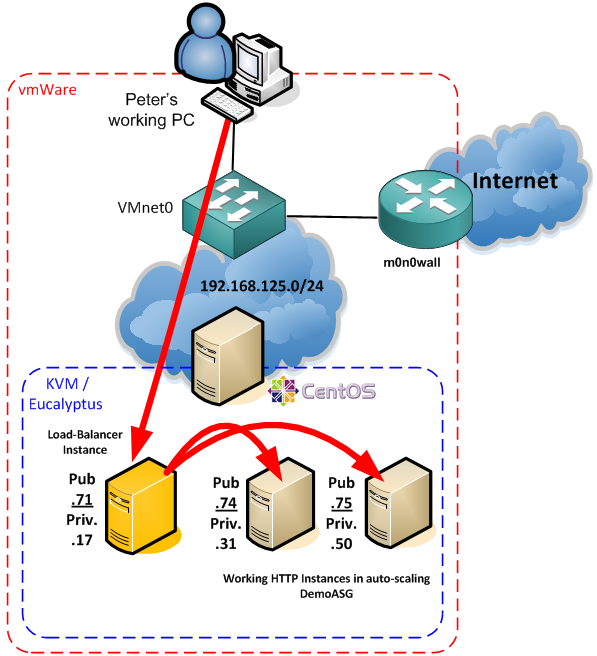
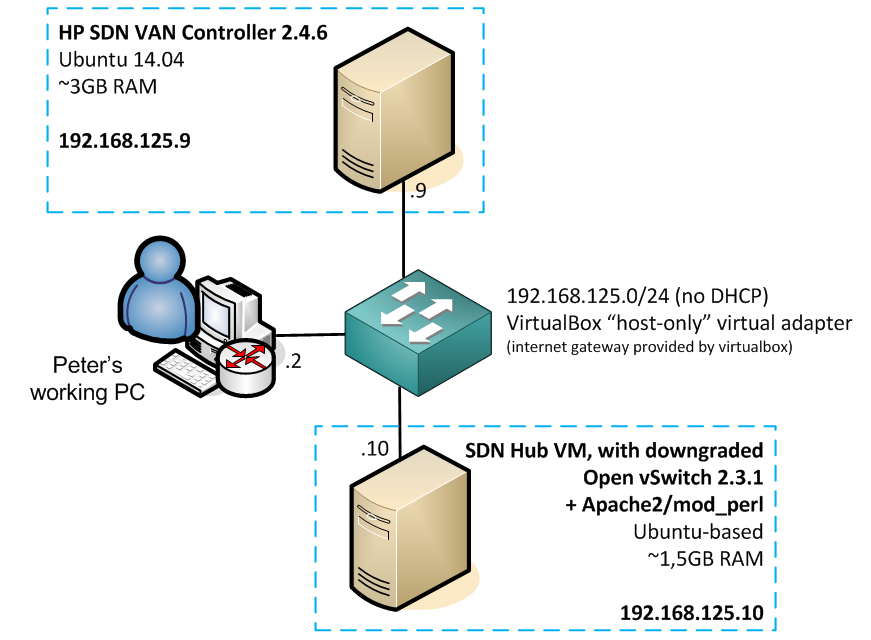
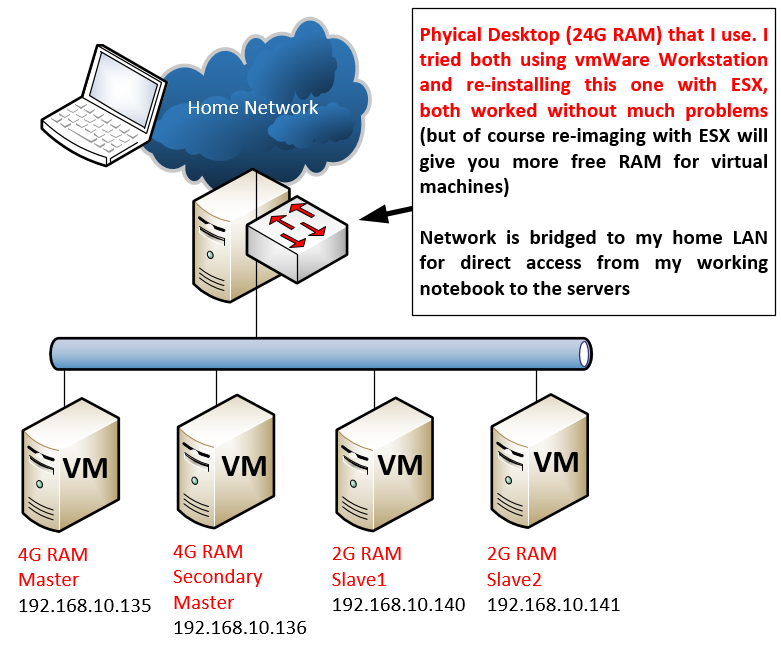
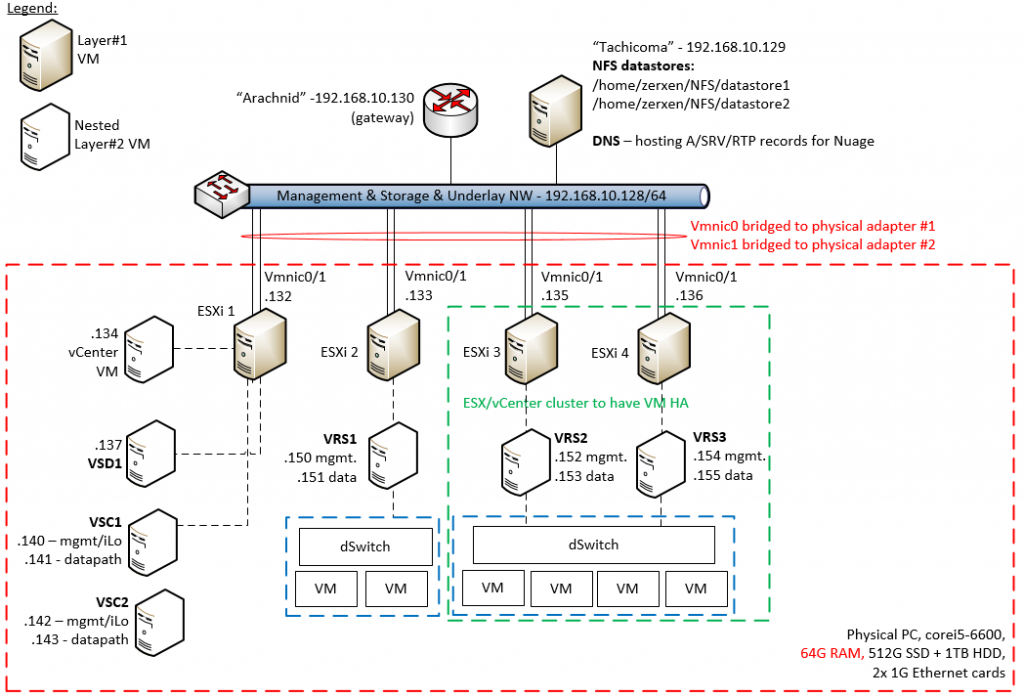
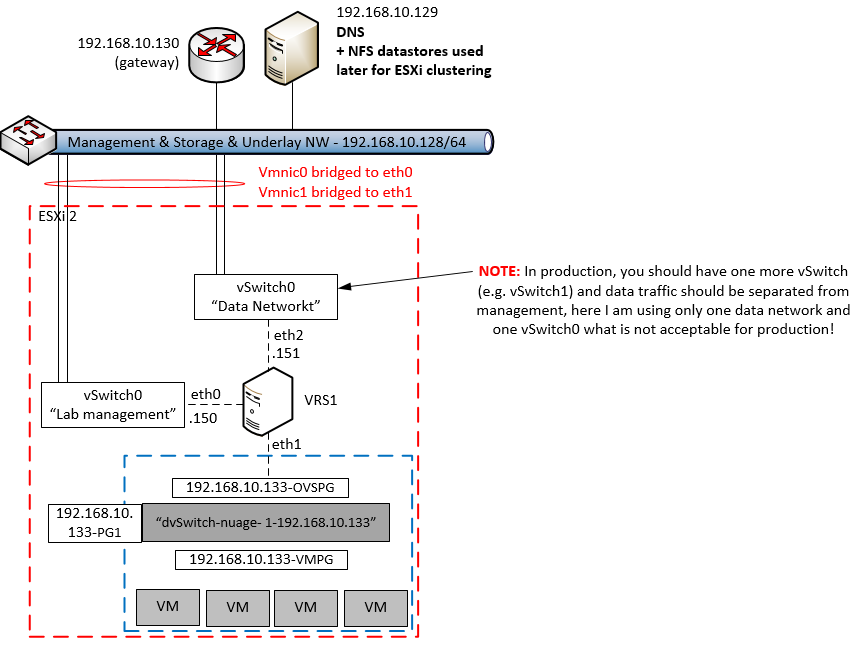
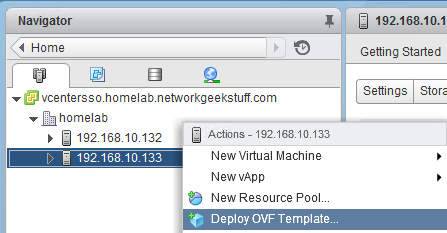
Before we go to the actual steps, let me show you the architecture that we will create in this LAB. The HP Helion is using the TripleO installation, which is part of OpenStack project as an installation path which deploys everything from pre-created system images.  HP modified this approach to give you a quick to deploy example topology, where the classical OpenStack components (which should normally run natively on baremetal servers) are also virtualized. This means that your single machine with 16GB will be running a first layer of virtualization and virtualize the OpenStack/HP Helion server nodes. And thse internal nodes will then run the end-user virtual machines. So we have a dual layer virtualization. Maybe to help you understand this (including the networks that will be created between them) I have put together this picture of the final architecture.

HP Helion GE - June 2014 installation using TripleO and deploying defalt virtual-in-virtual

HP Helion GE – June 2014 installation using TripleO and deploying default virtual-in-virtual

On the picture above, all servers with the exception of the “Host physical server” and my working PC are virtual machines. HP Helion deploys 4x virtual machine (4GB each) and then these machines will run smaller virtual systems inside. The “demo”, “test01″ and “Peter’s” virtual machines we will create (including advanced networking) in the steps below.

Step 1: Install Ubuntu 14.04 as base operating system

Step 2: install software packages needed

apt-get install -y libvirt-bin openvswitch-switch python-libvirt \
qemu-system-x86 qemu-kvm openssh-server

after the libvirt is installed, you have to restart its service

/etc/init.d/libvirt-bin restart

also generate a public/private key pair for root with. Do not create a passphrase for the keys, just hit enter when asked for new password

ssh-keygen -t rsa

Step 3: Unpack the installation hp_helion_openstack_community.tar.gz of HP Helion

You have downloaded the hp_helion_openstack_community.tar.gz from here. Now you need to extract it with tar command like this

tar zxvf hp_helion_openstack_community.tar.gz

Step 4: Start the seed VM

The Helion uses a tripleo installation system,

HP_VM_MODE=y 
bash -x ~root/tripleo/tripleo-incubator/scripts/hp_ced_start_seed.sh

The script will run for at minimum for a few minutes. Finishing with message similar to this:

HP - completed - Sun Jun  8 16:48:04 UTC 2014

At the end, you should see a “seed” virtual machine created in your host system, feel free to check the virsh list command

root@HPHelion1:~# virsh list
 Id    Name                           State
----------------------------------------------------
 0     seed                           running

 SCRIPT POSSIBLE FAILURE NOTE #1: The installation has run on my PC but ended with error like this:

error: Failed to start domain seed
error: unsupported configuration: SATA is not supported with this QEMU binary

I had to edit the virsh “seed machine” template in ~/tripleo/tripleo-incubator/templates/vm.xml

Just find this line:

<target dev='sda' bus='sata'/>

and change it to “ide”

<target dev='sda' bus='ide'/>

SCRIPT POSSIBLE FAILURE NOTE #2: The initial “seed” virtual machine will try to use 4096MB, if you want to try smaller RAM (for example I had to change it to 2048MB because my host server didn’t had enough RAM), you can open the ~/tripleo/tripleo-incubator/scripts/hp_ced_start_seed.sh, find a line there that contains “MEMORY=${NODE_MEM:-4096}” and change the 4096 there to the RAM value you need. However, prepare your HDD for quite intensive work as the virtual seed will extensively use the swap area.

Step 5: Start overcloud/undercloud

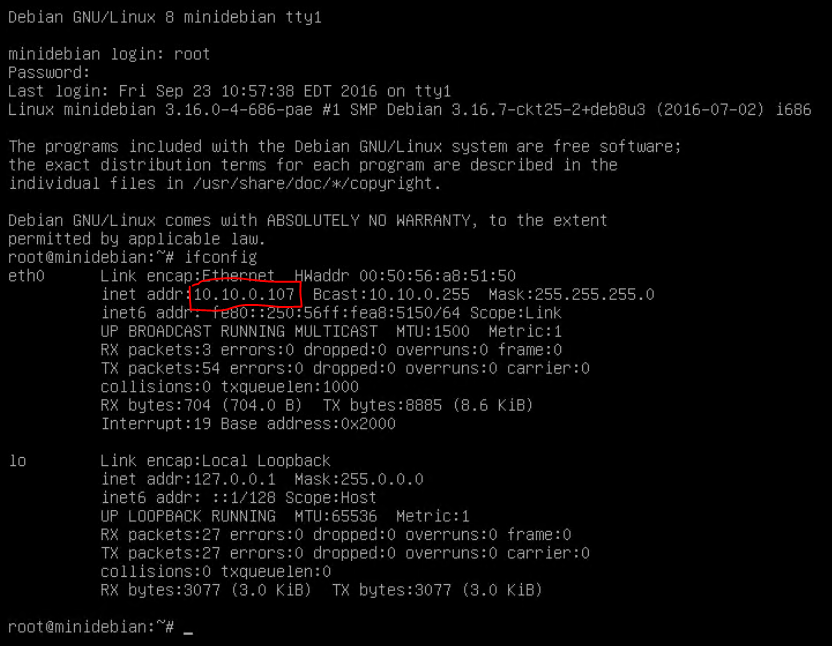
What Helion has don in Step 4 is that it created a virtual network and a few virtual bridge interfaces in your linux host. If you look at ifconfig, you will notice new interfaces and most importantly this one:

root@HPHelion1:~# ifconfig virbr0
virbr0    Link encap:Ethernet  HWaddr fe:54:00:6a:86:a8
          inet addr:192.168.122.1  Bcast:192.168.122.255  Mask:255.255.255.0
          UP BROADCAST RUNNING MULTICAST  MTU:1500  Metric:1
          RX packets:451 errors:0 dropped:0 overruns:0 frame:0
          TX packets:392 errors:0 dropped:0 overruns:0 carrier:0
          collisions:0 txqueuelen:0
          RX bytes:49375 (49.3 KB)  TX bytes:61062 (61.0 KB)

So we have a new network 192.168.122.0/24 and also, if you look at routing table, there is new static route for 192.0.2.0/24 in the routing table with next-hop to 192.168.122.103 (which is the seed VM).

root@HPHelion1:~# route -n
Kernel IP routing table
Destination     Gateway         Genmask         Flags Metric Ref    Use Iface
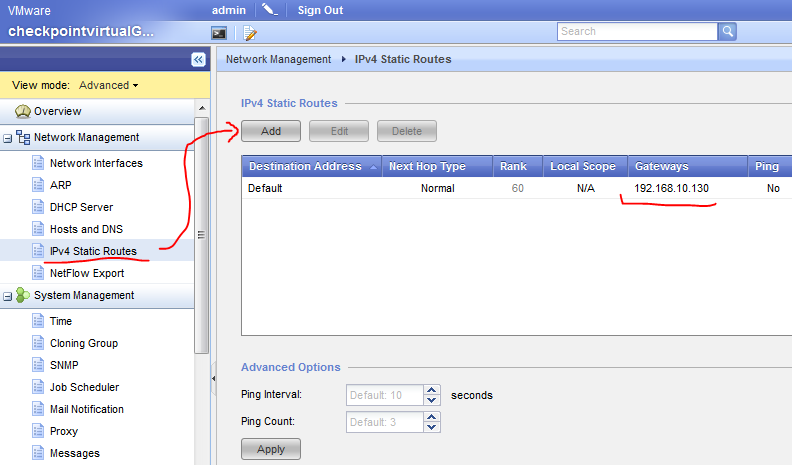
0.0.0.0         192.168.10.130  0.0.0.0         UG    0      0        0 eth0
192.0.2.0       192.168.122.103 255.255.255.0   UG    0      0        0 virbr0
192.168.10.128  0.0.0.0         255.255.255.192 U     0      0        0 eth0
192.168.122.0   0.0.0.0         255.255.255.0   U     0      0        0 virbr0

Now, let’s continue at connect to the seed VM with ssh 192.0.2.1 (execute as root) and you will end on the seed VM like this:

root@HPHelion:~# ssh 192.0.2.1
<ommitted>
root@hLinux:~#

Now what is needed is to run a similar script to create new virtual machines inside the virtual seed machine, lets call it “hLinux” for lack of a better word now.

bash -x ~root/tripleo/tripleo-incubator/scripts/hp_ced_installer.sh

I do not want to copy&paste everything from this installation, but note that on my system, this script took 2 hours to complete, mostly I believe because of the SATA drive (classical HDD, not SSD) which hosted 4x virtual machines that all wanted to use their virtual drives. So this slowed the system significantly. Interesting points to notice in the installation are these different identifications of API access and initial virtual machines definitions:

THIS INSTALL LOG BELOW IS JUST “FYI”,
IF YOU HAD NO PROBLEMS/ERRORS IN YOUR INSTALL, FEEL FREE TO SKIP TO STEP 6.

+-------------+----------------------------------+
|   Property  |              Value               |
+-------------+----------------------------------+
|   adminurl  |   http://192.0.2.1:35357/v2.0    |
|      id     | de7a8875c4e34d388338d2d82df2193f |
| internalurl |    http://192.0.2.1:5000/v2.0    |
|  publicurl  |    http://192.0.2.1:5000/v2.0    |
|    region   |            regionOne             |
|  service_id | b7a68ce3dc094ae795dc5fdc6799cc0c |
+-------------+----------------------------------+
Service identity created
+ setup-endpoints 192.0.2.1 --glance-password unset --heat-password unset --neutron-password unset --nova-password unset
No user with a name or ID of 'heat' exists.
+-------------+----------------------------------------+
|   Property  |                 Value                  |
+-------------+----------------------------------------+
|   adminurl  | http://192.0.2.1:8004/v1/%(tenant_id)s |
|      id     |    26d2083e2aa14af09e118c1cf2b5425b    |
| internalurl | http://192.0.2.1:8004/v1/%(tenant_id)s |
|  publicurl  | http://192.0.2.1:8004/v1/%(tenant_id)s |
|    region   |               regionOne                |
|  service_id |    5046569b46ca4adba810ee059ba0458f    |
+-------------+----------------------------------------+
Service orchestration created
No user with a name or ID of 'neutron' exists.
+-------------+----------------------------------+
|   Property  |              Value               |
+-------------+----------------------------------+
|   adminurl  |      http://192.0.2.1:9696/      |
|      id     | 3e2019589728491ca11ce4b3ba084b00 |
| internalurl |      http://192.0.2.1:9696/      |
|  publicurl  |      http://192.0.2.1:9696/      |
|    region   |            regionOne             |
|  service_id | 24afe3d3797f4ed9a196160bde6bdf5b |
+-------------+----------------------------------+
Service network created
No user with a name or ID of 'glance' exists.
+-------------+----------------------------------+
|   Property  |              Value               |
+-------------+----------------------------------+
|   adminurl  |      http://192.0.2.1:9292/      |
|      id     | 7bca793c84504ee3bd8a77846aa604f1 |
| internalurl |      http://192.0.2.1:9292/      |
|  publicurl  |      http://192.0.2.1:9292/      |
|    region   |            regionOne             |
|  service_id | 2ff2d413b5f04ca7aa6c8fd2cec65971 |
+-------------+----------------------------------+
Service image created
No user with a name or ID of 'ec2' exists.
+-------------+--------------------------------------+
|   Property  |                Value                 |
+-------------+--------------------------------------+
|   adminurl  | http://192.0.2.1:8773/services/Admin |
|      id     |   6bf46d7e33294b589f575ffc10fa6592   |
| internalurl | http://192.0.2.1:8773/services/Cloud |
|  publicurl  | http://192.0.2.1:8773/services/Cloud |
|    region   |              regionOne               |
|  service_id |   2f08c13c51664c7ab48329c6723af6f6   |
+-------------+--------------------------------------+
Service ec2 created
No user with a name or ID of 'nova' exists.
+-------------+----------------------------------------+
|   Property  |                 Value                  |
+-------------+----------------------------------------+
|   adminurl  | http://192.0.2.1:8774/v2/$(tenant_id)s |
|      id     |    a9d0eaaa823b4fdbbc14daa7b4717dfc    |
| internalurl | http://192.0.2.1:8774/v2/$(tenant_id)s |
|  publicurl  | http://192.0.2.1:8774/v2/$(tenant_id)s |
|    region   |               regionOne                |
|  service_id |    37cacb6157d94f4cac62be090702e552    |
+-------------+----------------------------------------+
Service compute created
+-------------+----------------------------------+
|   Property  |              Value               |
+-------------+----------------------------------+
|   adminurl  |     http://192.0.2.1:8774/v3     |
|      id     | 84de8d8141494b9b99c4b109f461247c |
| internalurl |     http://192.0.2.1:8774/v3     |
|  publicurl  |     http://192.0.2.1:8774/v3     |
|    region   |            regionOne             |
|  service_id | d02b76ad1ebb4ea0a7a02850b526b0dc |
+-------------+----------------------------------+
Service computev3 created
+ keystone role-create --name heat_stack_user
+----------+----------------------------------+
| Property |              Value               |
+----------+----------------------------------+
|    id    | d1aeb2393fc8455ca8762494be0c5e7c |
|   name   |         heat_stack_user          |
+----------+----------------------------------+
+ keystone role-create --name=swiftoperator
+----------+----------------------------------+
| Property |              Value               |
+----------+----------------------------------+
|    id    | 57d9e615646b418f8253304181d7c7b8 |
|   name   |          swiftoperator           |
+----------+----------------------------------+
+ keystone role-create --name=ResellerAdmin
+----------+----------------------------------+
| Property |              Value               |
+----------+----------------------------------+
|    id    | dafea872903e49a58ef14b8e3b3593aa |
|   name   |          ResellerAdmin           |
+----------+----------------------------------+
++ setup-neutron '' '' 10.0.0.0/8 '' '' '' 192.0.2.45 192.0.2.64 192.0.2.0/24
Created a new router:
+-----------------------+--------------------------------------+
| Field                 | Value                                |
+-----------------------+--------------------------------------+
| admin_state_up        | True                                 |
| external_gateway_info |                                      |
| id                    | ba1476fc-2922-44ed-ba81-af5d3e156865 |
| name                  | default-router                       |
| status                | ACTIVE                               |
| tenant_id             | 73c6d757dac243a0a9b9143b5f6be2e3     |
+-----------------------+--------------------------------------+
Added interface 90dd4dae-2f16-45fd-8b68-4fa54985dde0 to router default-router.
Created a new network:
+---------------------------+--------------------------------------+
| Field                     | Value                                |
+---------------------------+--------------------------------------+
| admin_state_up            | True                                 |
| id                        | c0edfb5c-fa09-49e6-92fe-014e60c6d095 |
| name                      | ext-net                              |
| provider:network_type     | vxlan                                |
| provider:physical_network |                                      |
| provider:segmentation_id  | 1002                                 |
| router:external           | True                                 |
| shared                    | False                                |
| status                    | ACTIVE                               |
| subnets                   |                                      |
| tenant_id                 | 73c6d757dac243a0a9b9143b5f6be2e3     |
+---------------------------+--------------------------------------+
Set gateway for router default-router
++ os-adduser -p a304b9d3c3d9def5c4978ed7f0ca3e622a5d6f1c demo demo@example.com
Created user demo with password 'a304b9d3c3d9def5c4978ed7f0ca3e622a5d6f1c'
++ nova flavor-delete m1.tiny
++ nova flavor-create m1.tiny 1 512 2 1
+----+---------+-----------+------+-----------+------+-------+-------------+-----------+
| ID | Name    | Memory_MB | Disk | Ephemeral | Swap | VCPUs | RXTX_Factor | Is_Public |
+----+---------+-----------+------+-----------+------+-------+-------------+-----------+
| 1  | m1.tiny | 512       | 2    | 0         |      | 1     | 1.0         | True      |
+----+---------+-----------+------+-----------+------+-------+-------------+-----------+

At the end, you should see something similar to this:

HP - completed - Sun Jun  8 16:48:04 UTC 2014

Step 6: Verification of your install

There are verification steps that you can do inside both the seed VM (hLinux) and also your server OS.

Lets start with the test provided by HP Helion scripts which will list the overcloud VMs and undercloud VMs, which are the infrastructure VMs running the Compute and Controller nodes.

root@hLinux:~# source ~root/tripleo/tripleo-undercloud-passwords
root@hLinux:~# TE_DATAFILE=~/tripleo/testenv.json
root@hLinux:~# source ~root/tripleo/tripleo-incubator/undercloudrc
root@hLinux:~# nova list
+--------------------------------------+-------------------------------------+--------+------------+-------------+---------------------+
| ID                                   | Name                                | Status | Task State | Power State | Networks            |
+--------------------------------------+-------------------------------------+--------+------------+-------------+---------------------+
| 1d51fdd8-468c-4988-b717-74a47e1f6914 | overcloud-NovaCompute0-4r2q45kefrrm | ACTIVE | -          | Running     | ctlplane=192.0.2.22 |
| 30709eb7-511f-4bea-bcfa-58b7ee01c9cf | overcloud-controller0-6yxubmu4x2eg  | ACTIVE | -          | Running     | ctlplane=192.0.2.23 |
+--------------------------------------+-------------------------------------+--------+------------+-------------+---------------------+

Second, this series will show you the overcloud VMs, which are the instances running as if end user VMs. Based on this list, you will find the defaulty provided example “demo” Instance and you can also ping the “demo” VM on its 192.x.x.x interface:

root@hLinux:~# source ~root/tripleo/tripleo-overcloud-passwords
root@hLinux:~# TE_DATAFILE=~/tripleo/testenv.json
root@hLinux:~# source ~root/tripleo/tripleo-incubator/overcloudrc-user
root@hLinux:~# nova list
+--------------------------------------+------+--------+------------+-------------+----------------------------------+
| ID                                   | Name | Status | Task State | Power State | Networks                         |
+--------------------------------------+------+--------+------------+-------------+----------------------------------+
| 9e40b5b0-c70d-4797-9b95-c3d3e39c897e | demo | ACTIVE | -          | Running     | default-net=10.0.0.2, 192.0.2.46 |
+--------------------------------------+------+--------+------------+-------------+----------------------------------+
-
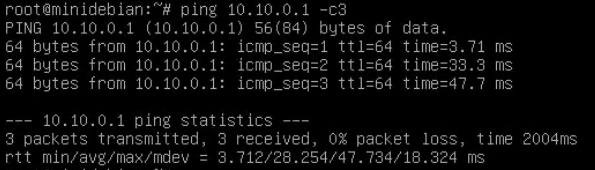
root@hLinux:~# ping 192.0.2.46
PING 192.0.2.46 (192.0.2.46) 56(84) bytes of data.
64 bytes from 192.0.2.46: icmp_seq=1 ttl=63 time=12.2 ms
64 bytes from 192.0.2.46: icmp_seq=2 ttl=63 time=3.66 ms
^C
--- 192.0.2.46 ping statistics ---
2 packets transmitted, 2 received, 0% packet loss, time 1001ms
rtt min/avg/max/mdev = 3.662/7.965/12.268/4.303 ms

Additionally, the seed VM has extracted a public keys for SSH access to all the nodes, therefore you can also SSH to the nova “demo” VM:

root@hLinux:~# ssh 192.0.2.46
The authenticity of host '192.0.2.46 (192.0.2.46)' can't be established.
ECDSA key fingerprint is f8:64:aa:0c:77:95:db:7c:d7:0a:4d:e2:50:e1:b9:d9.
Are you sure you want to continue connecting (yes/no)? yes

root@demo:~#

In the host system (in my Lab called HPHelion1), we can check what is actually all running here. First, I noticed in the standard top command, that 4x qemu system is running and taking quite a lot of RAM, also the nova controller IP is pingable.

root@HPHelion1:/home/zerxen# ping 192.168.10.130
PING 192.168.10.130 (192.168.10.130) 56(84) bytes of data.
64 bytes from 192.168.10.130: icmp_seq=1 ttl=64 time=0.438 ms
64 bytes from 192.168.10.130: icmp_seq=2 ttl=64 time=0.400 ms
^C
--- 192.168.10.130 ping statistics ---
2 packets transmitted, 2 received, 0% packet loss, time 999ms
rtt min/avg/max/mdev = 0.400/0.419/0.438/0.019 ms
root@HPHelion1:~# top
top - 18:49:35 up  2:04,  4 users,  load average: 1.58, 3.98, 5.82
Tasks: 150 total,   2 running, 148 sleeping,   0 stopped,   0 zombie
%Cpu(s): 26.7 us,  0.8 sy,  0.0 ni, 71.0 id,  1.5 wa,  0.0 hi,  0.0 si,  0.0 st
KiB Mem:  16371060 total, 16192012 used,   179048 free,     6184 buffers
KiB Swap: 11717628 total,  2261536 used,  9456092 free.  1229164 cached Mem

  PID USER      PR  NI    VIRT    RES    SHR S  %CPU %MEM     TIME+ COMMAND
 3858 libvirt+  20   0 6735060 4.002g   4652 S   3.7 25.6   7:09.02 qemu-system-x86
 5119 libvirt+  20   0 6743128 3.943g   4940 S 101.0 25.3   5:19.03 qemu-system-x86
 4617 libvirt+  20   0 6587532 3.926g   4644 S   1.9 25.1   3:42.09 qemu-system-x86
 3171 libvirt+  20   0 6689580 1.962g   4640 S   2.3 12.6   6:27.98 qemu-system-x86
  766 root      10 -10  243044  32028   6404 S   0.0  0.2   0:06.61 ovs-vswitchd
 1209 root      20   0  962388   6776   4756 S   0.0  0.0   0:01.81 libvirtd

Even better, using the virsh list command you can see the machines running our system

root@HPHelion1:/home/zerxen# virsh list
 Id    Name                           State
----------------------------------------------------
 4     seed                           running
 5     baremetal_0                    running
 6     baremetal_1                    running
 7     baremetal_3                    running

Step 7: Connecting to the Horizon console

First, we have to get the keys, then list the nova controller for the horizon undercloud node IP like this.

root@hLinux:~# source ~root/tripleo/tripleo-undercloud-passwords
root@hLinux:~# TE_DATAFILE=~/tripleo/testenv.json
root@hLinux:~# source ~root/tripleo/tripleo-incubator/undercloudrc
root@hLinux:~# nova list
+--------------------------------------+-------------------------------------+--------+------------+-------------+---------------------+
| ID                                   | Name                                | Status | Task State | Power State | Networks            |
+--------------------------------------+-------------------------------------+--------+------------+-------------+---------------------+
| 1d51fdd8-468c-4988-b717-74a47e1f6914 | overcloud-NovaCompute0-4r2q45kefrrm | ACTIVE | -          | Running     | ctlplane=192.0.2.22 |
| 30709eb7-511f-4bea-bcfa-58b7ee01c9cf | overcloud-controller0-6yxubmu4x2eg  | ACTIVE | -          | Running     | ctlplane=192.0.2.23 |
+--------------------------------------+-------------------------------------+--------+------------+-------------+---------------------+

Notice that we now see two different machines, one is using 192.0.2.22 and the second using 192.0.2.23. These two boxes are the “overcloud” and for horizon console, we need to connect to the overcloud-controller.

The passwords were automatically generated during installation, to read them, open this file ~root/tripleo/tripleo-overcloud-passwords.

root@hLinux:~# cat ~root/tripleo/tripleo-overcloud-passwords
OVERCLOUD_ADMIN_TOKEN=e7d24cc02607fa6ecdcaab72d7b40e5a0212365b
OVERCLOUD_ADMIN_PASSWORD=2f1d8666540c6cb192b0f74fadbce32eff2f3493
OVERCLOUD_CEILOMETER_PASSWORD=a07f05b1730eac806f9391b3ef1167b0905c5121
OVERCLOUD_CINDER_PASSWORD=e42d485c675ca118e43486b8dbc2ff2cb061e9c0
OVERCLOUD_GLANCE_PASSWORD=85b347e23fd022076f488c166e44596461515b2e
OVERCLOUD_HEAT_PASSWORD=ab4a3b2a73fc874501f189a2c3e06e40025d3ea0
OVERCLOUD_NEUTRON_PASSWORD=11e26addc33a2f7ab79788ed6eb92ee6d911ea81
OVERCLOUD_NOVA_PASSWORD=5a90eb1c6a3ef73d671f72fe47b7557e002eb42e
OVERCLOUD_SWIFT_PASSWORD=9e05710e7d8bd24aeeb91e2d44f81f2fd6cc8fd0
OVERCLOUD_SWIFT_HASH=1b95f901113e32d8b7cdd3e046207d657660f750
OVERCLOUD_DEMO_PASSWORD=a304b9d3c3d9def5c4978ed7f0ca3e622a5d6f1c

For horizon dashboards, note the OVERCLOUD_DEMO_PASSWORD and OVERCLOUD_ADMIN_PASSWORD.

If you have installed the HPHelion on your host ubuntu and you are sitting in front of this box with graphical environment present, you can now simply open a web-browser and go to http://192.0.2.23/, in my case, the LAB is remote and I only have access to the host ubuntu as a server, so for me the 192.x.x.x IPs are behind it, however a classical reverse SSH tunnel solved this for me (actually the idea is from HP Helion install guide).

For linux:
ssh -L 9999:<IP of overcloud controller>:80:<hostname or IP of remote system>

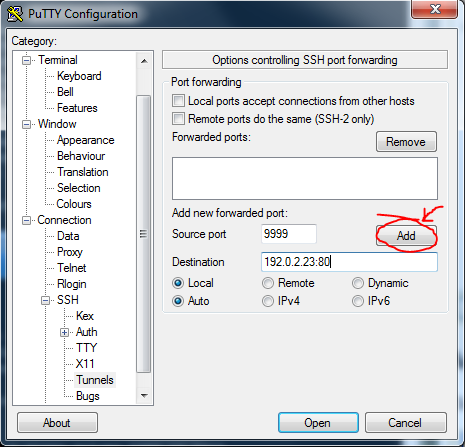
In windows, you can use putty for this:
putty_forwarding

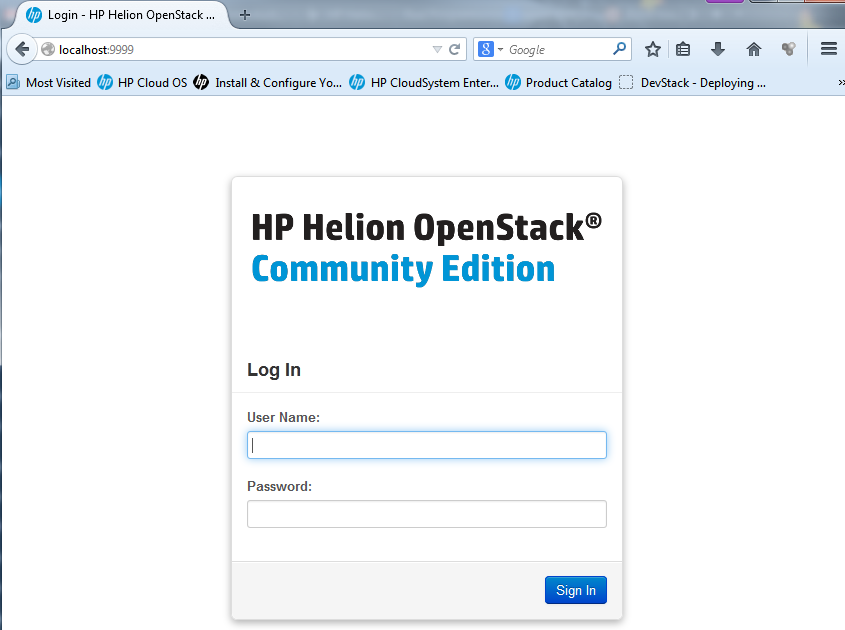
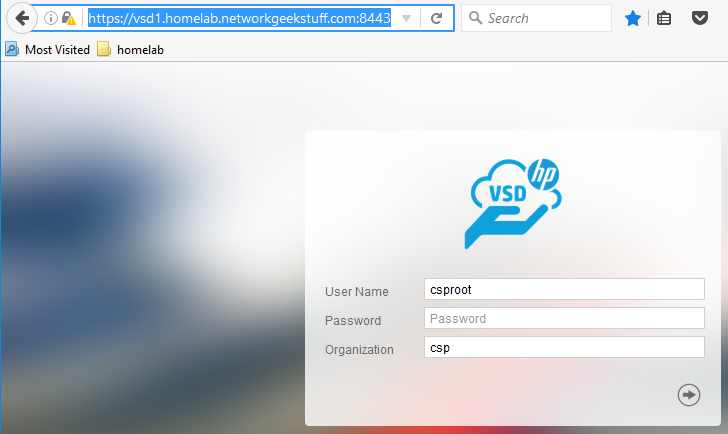
Then you can finally open a web-browser and enter the fabulous Horizon console (yes, exaggerating as I spent getting to this point around 8 hours of various lab issues) either directly or in my case I used SSH forwarder in localhost:9999 as mentioned above with putty.
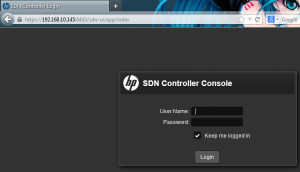
HP Helion login screen

HP Helion login screen

HP Helion first time look to the dashboard

HP Helion first time look to the dashboard

Testing (or “playing with”) HP Helion horizon dashboard

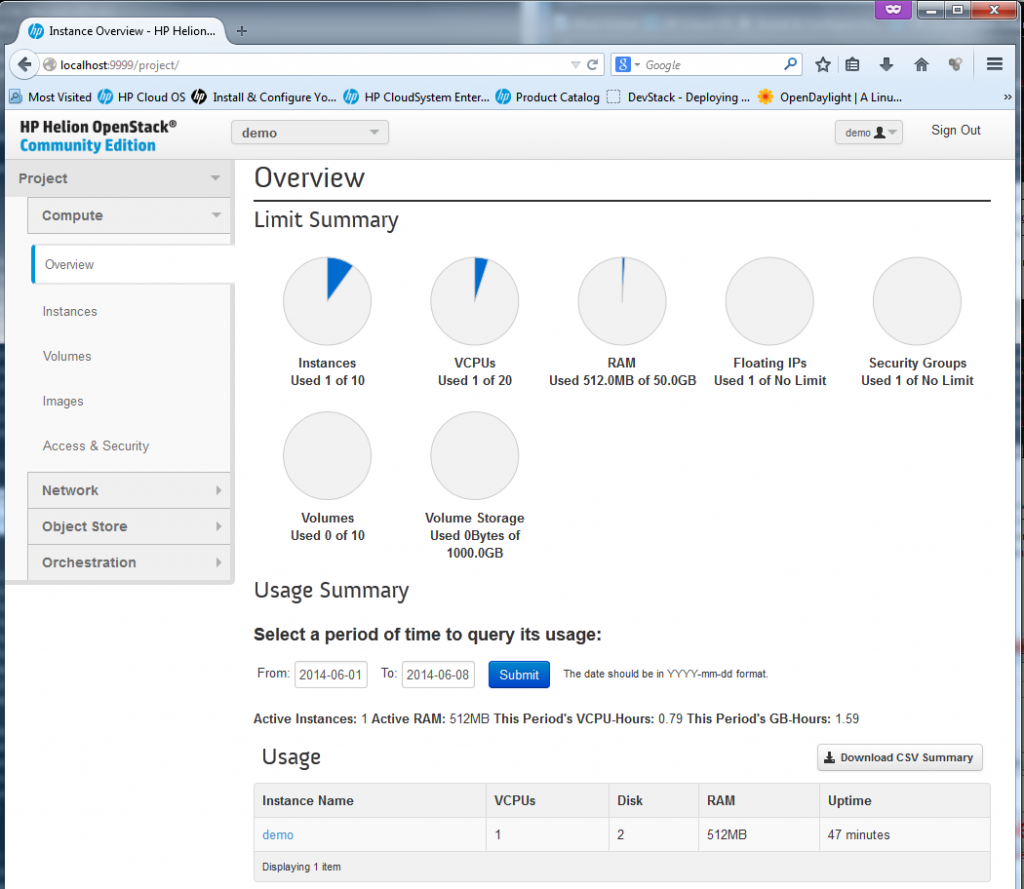
Ok, lets have a look on all the main sections that appeared “by default”. First part is for a “Compute” which deals with everything related to running and managing all VMs.
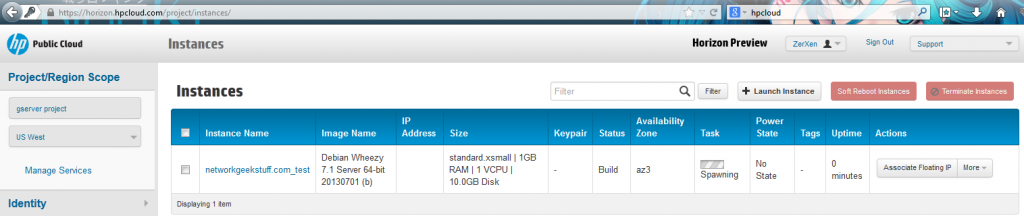
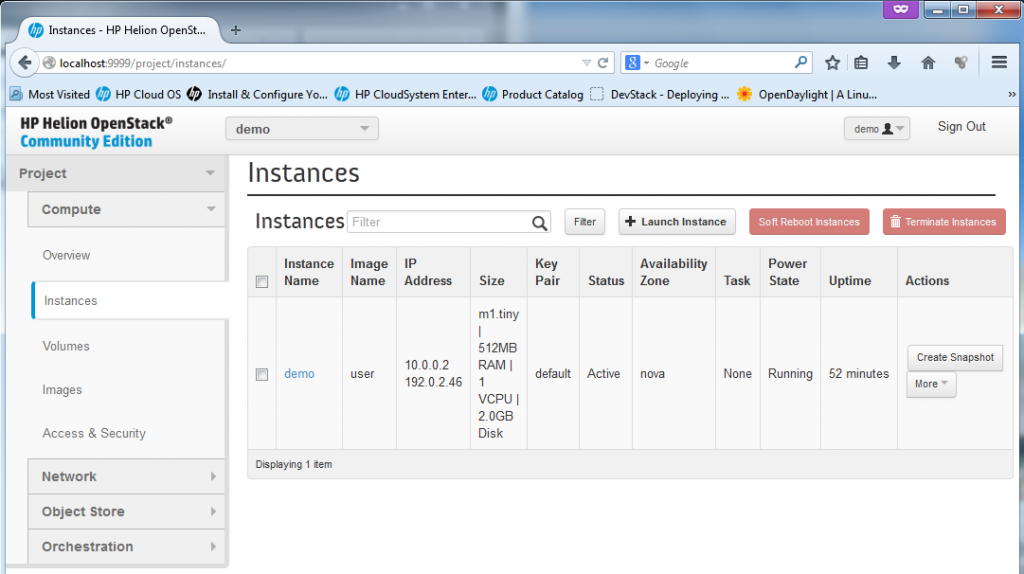
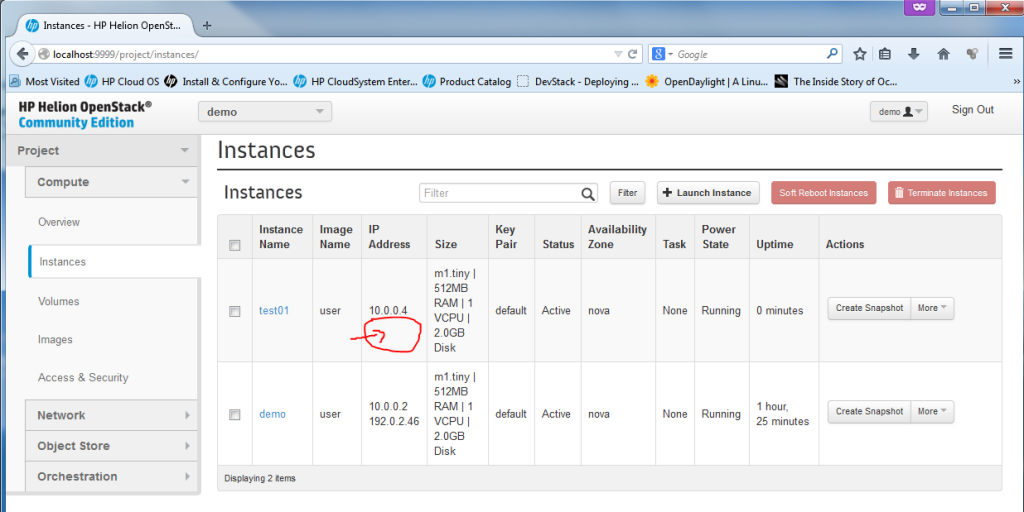
Existing virtual machines or "instances", by default the HP Helion comes with the "demo" VM created.

Existing virtual machines or “instances”, by default the HP Helion comes with the “demo” VM created.

The Instances is the main view on the existing virtual machines in the “cloud”, by default HP Helion provided one “demo” box as example. The box already has a floating IP assigned to it. We will play much more in this section later.
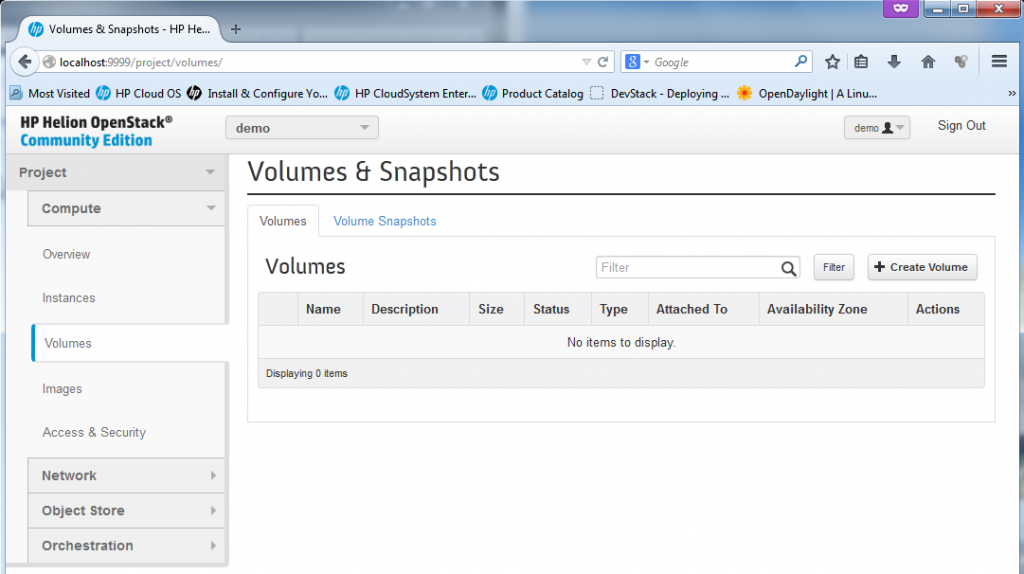
The "volumes" section is quite empty, the volumes is a place where dynamically mounted storage can be created.

The “volumes” section is quite empty, the volumes is a place where dynamically mounted storage can be created.

Tho volumes are used for dynamic block storage, it is a generic storage that can be mounted/unmounted dynamically to virtual machines. Foe example for linux the storage would appear as /dev/sdX and can be universally mounted.
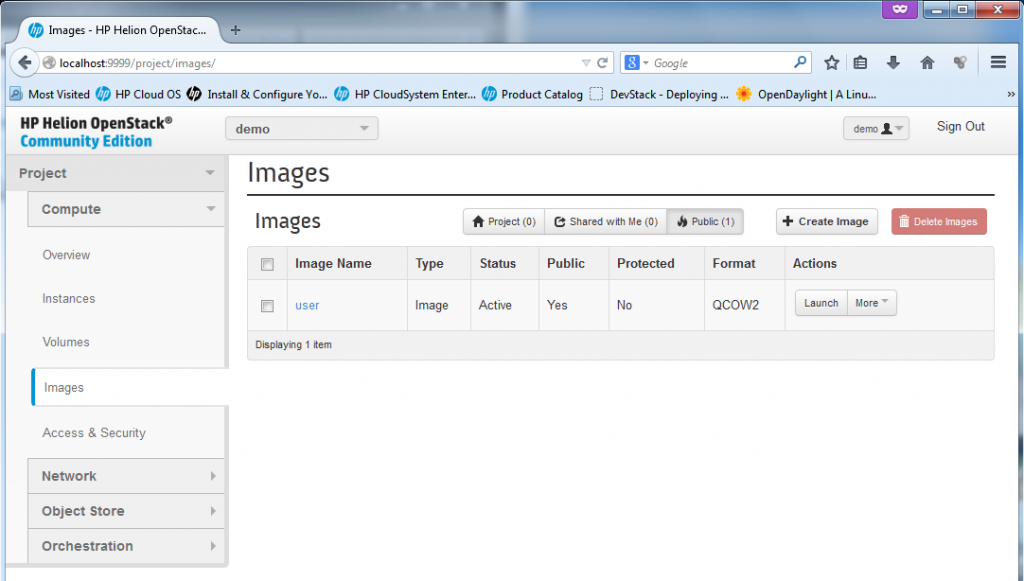
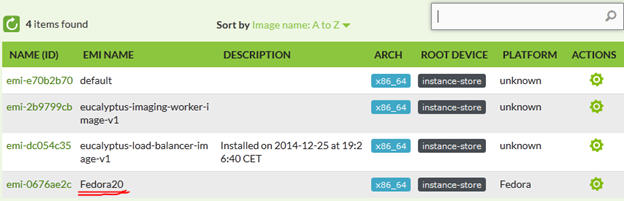
The images section enables management of "template" images for new VM creation

The images section enables management of “template” images for new VM creation

The images section is where the VM creation automation can happen, by default the HP Helion comes with one image called “user” in QCOW2 format. You can find files for this image in the installation scripts if you wish to learn how to create your own.
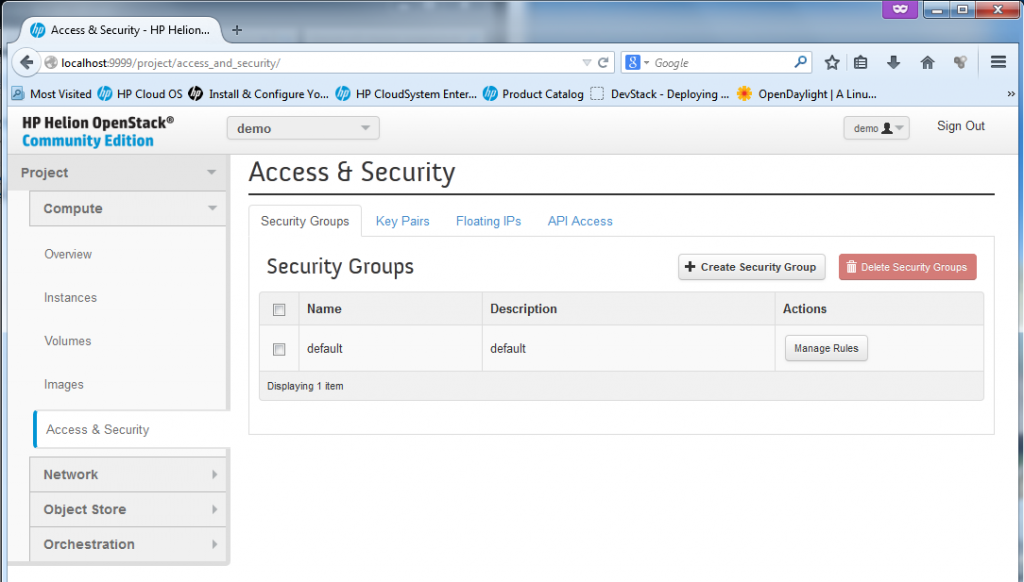
The security section for management of access rules (technically firewall rules) for each VM.

The security section for management of access rules (technically firewall rules) for each VM

The security section is used for thee main things.

1) Firewall rules for port access to each VM
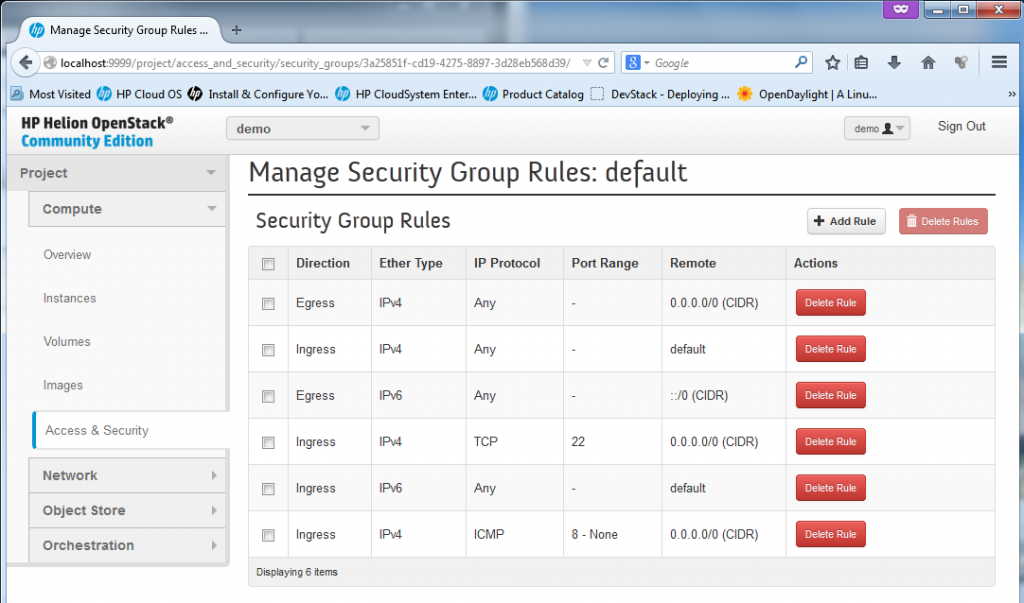
Firewall rules management in OpenStack with creation of "access groups"

Firewall rules management in OpenStack with creation of “security group rules”

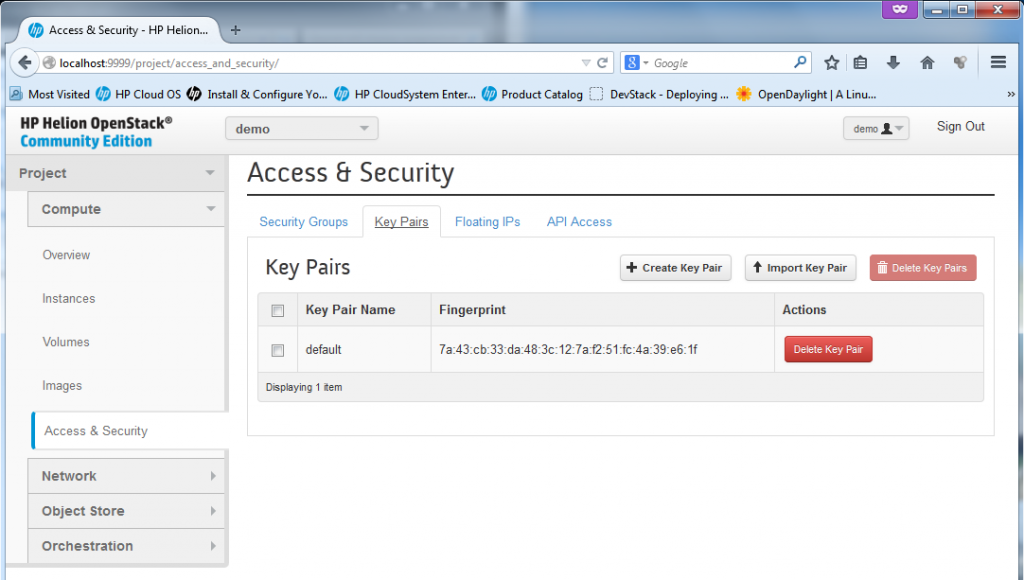
2) Management of private/public keypairs. OpenStack utilizes (or let’s say prefers) using SSH keys for access to servers (or at least to all *nix systems), therefore management of such keys is needed in Horizon and it is found here in Access&Security section. PS: By default the Horizon only wants the public key from you, so you can keep the private one on your PC and do not expose it! By default the HP Helion will use the keys which we originally created at the very beginning by ssh-keygen,

SSH private/public key pairs management

SSH private/public key pairs management

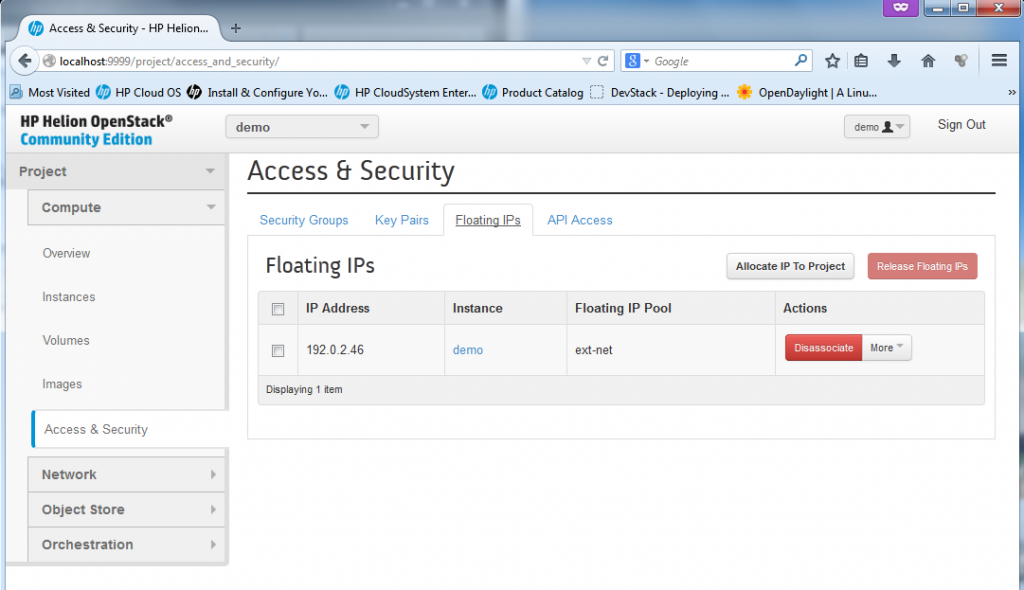
3) Management of floating IPs. A floating IP is a NAT IP given to a server so that the server can be reachable from the “outside” which means from the hosting server, or even from any external networks outside of cloud. You will see example IP provided later below.

Floating IP management

Floating IP management

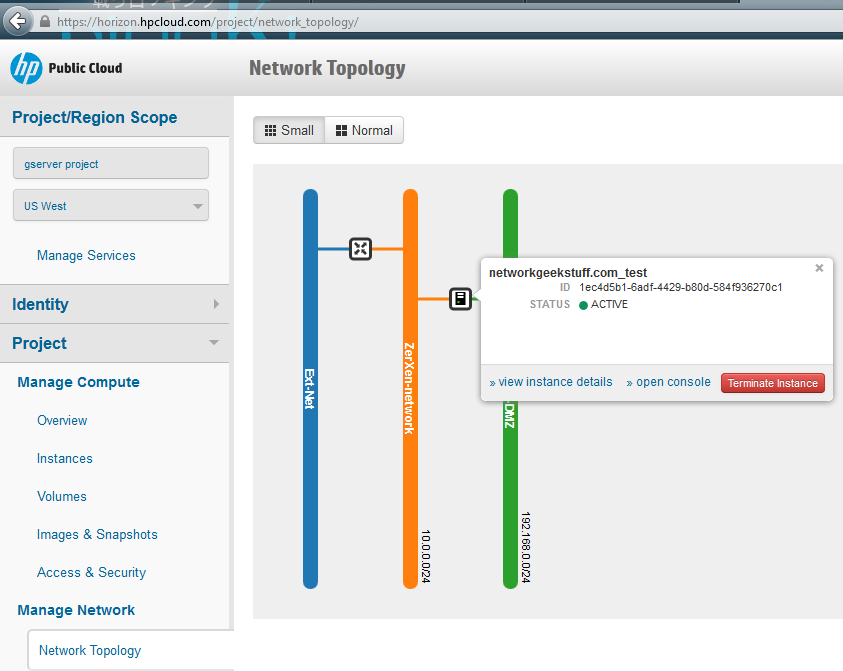
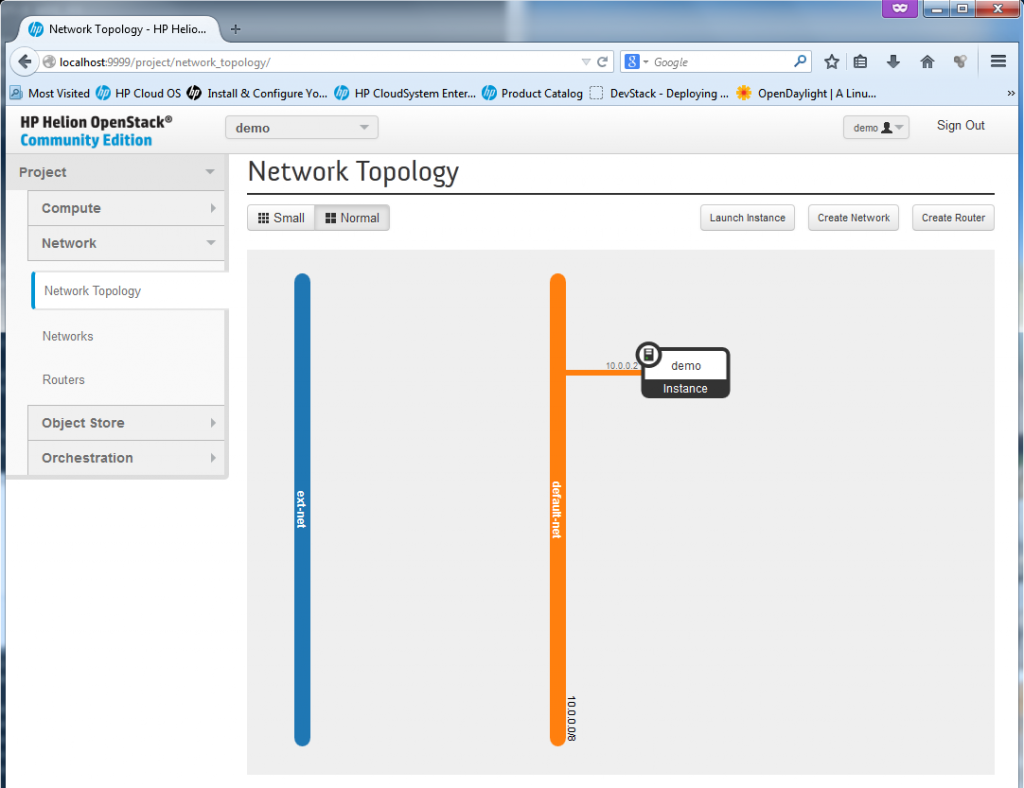
Following the security as last section in the “Compute”, we can now move to the “Network” part. In the basic HP Helion installation, there exists the ext-net defined as 192.0.2.0/24 which provides the publicly reachable IPs (or should be in production environment) and then one default-net with internal IPs of 10.0.0.0/24.

Basic HP Helion network topology (the router with 10.0.0.1 connecting ext-net and default-net is missing as a bug)

Basic HP Helion network topology (the router with 10.0.0.1 connecting ext-net and default-net is missing because the routers is under ADMIN!!)

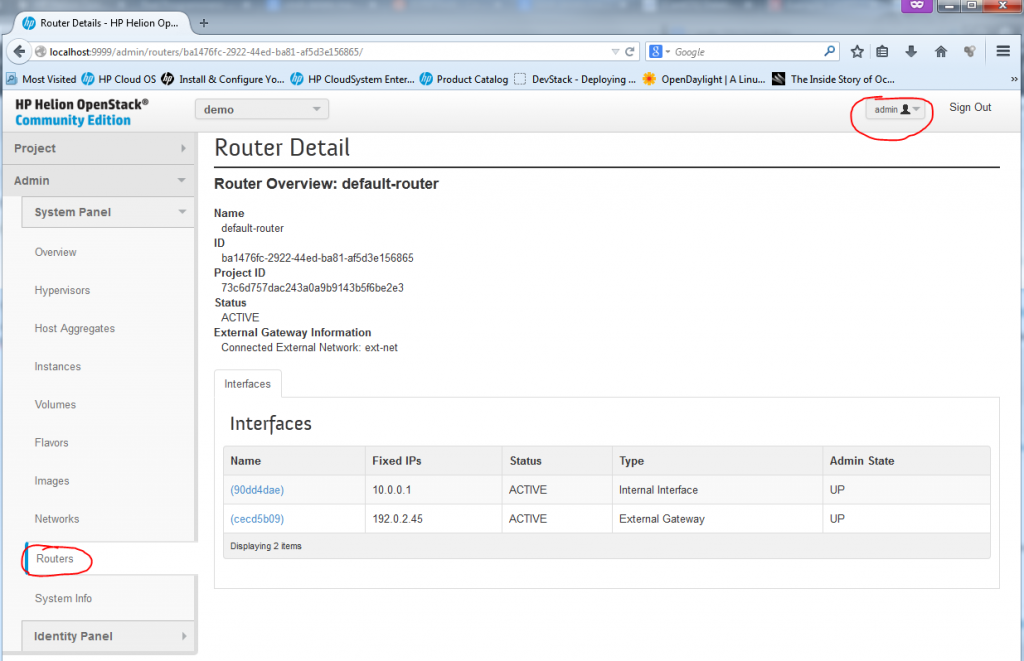
REMARK: The router between default-net and ext-net exists! But it is created by default under ADMIN account, if you want to see it, log-out the demo account and login as admin. Then in the routers section, you will see a router with two interfaces, one to ext-net and another to default-net. He is a look on it under Admin -> System Panel -> Routers:

Default router between default-net and ext-net hidden under administrative login

Default router between default-net and ext-net hidden under administrative login

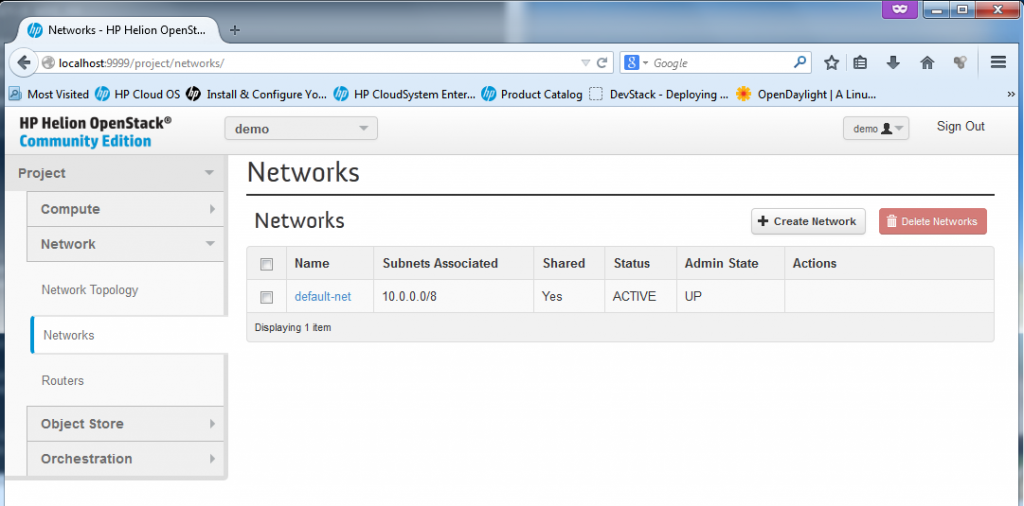
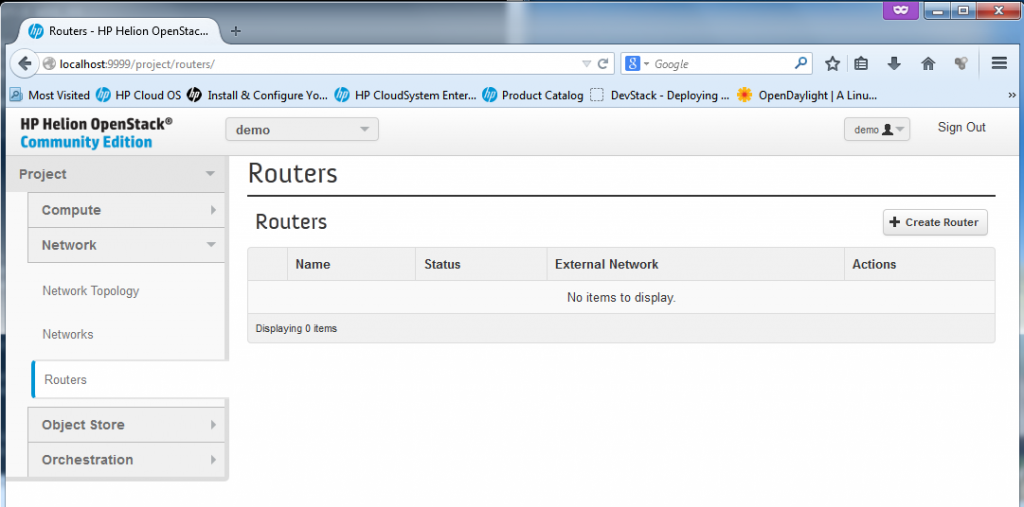
There is also a management page for definitions of “Networks” and “Routers”, in these two you can create for your new VMs multiples independent subnets and interconnects between them, I will go in details to each later below.

Network definitions in HP Helion

Network definitions in HP Helion

Routers definition in HP Helion

Routers definition in HP Helion (see REMARK above for the default router hidden under “admin” login)

Creating a new Instance

Part 1 – “Launch Instance”, VM parameters

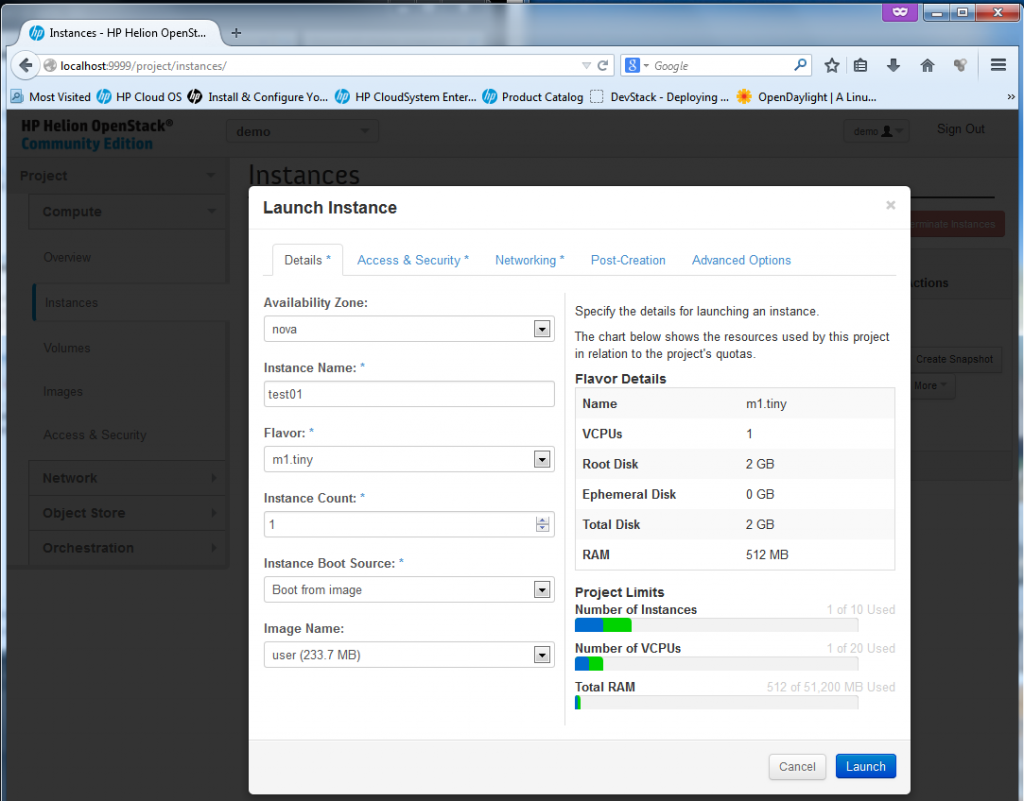
Ok, you have seen the “Instance” section under “Compute” above, now lets try to create quickly one new virtual machine there. Lets start by returning to Compute->Instances and select “Launch Instance“.  I will create a new instance called  “test01″, it will be a minimal image (because really, my server doesn’t have much RAM or CPU resources left).

Creating new Instance, part 1 - resource allocation, image selection

Creating new Instance, part 1 – resource allocation, image selection

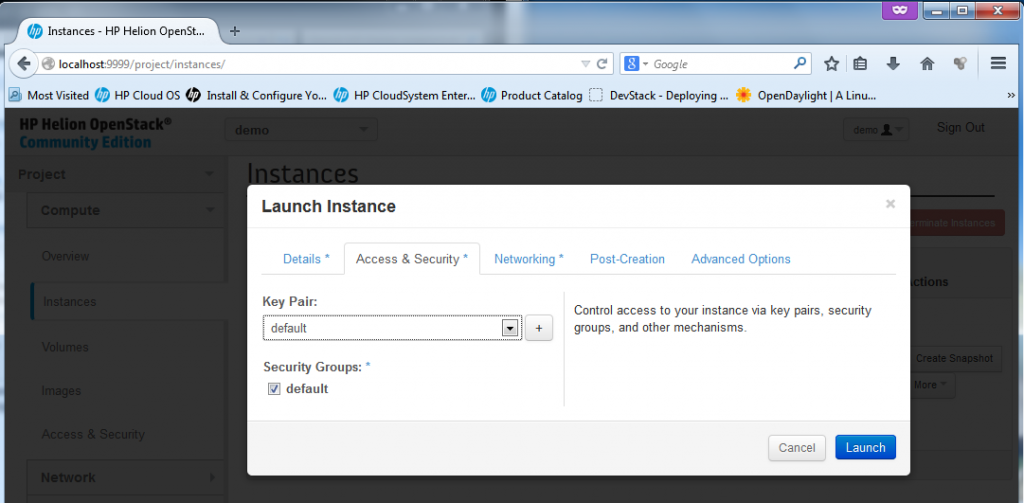
Part 2 – Launch Instance – keypair and security group

Next we have to define the Access&Security, I do not plan to change the default FW rules as the ping and SSH is allowed there (see previous section screenshots). So I will go with the defaults here, including the default keypair.

Creating new Instance, part 1 - security rules

Creating new Instance, part 2 – security rules

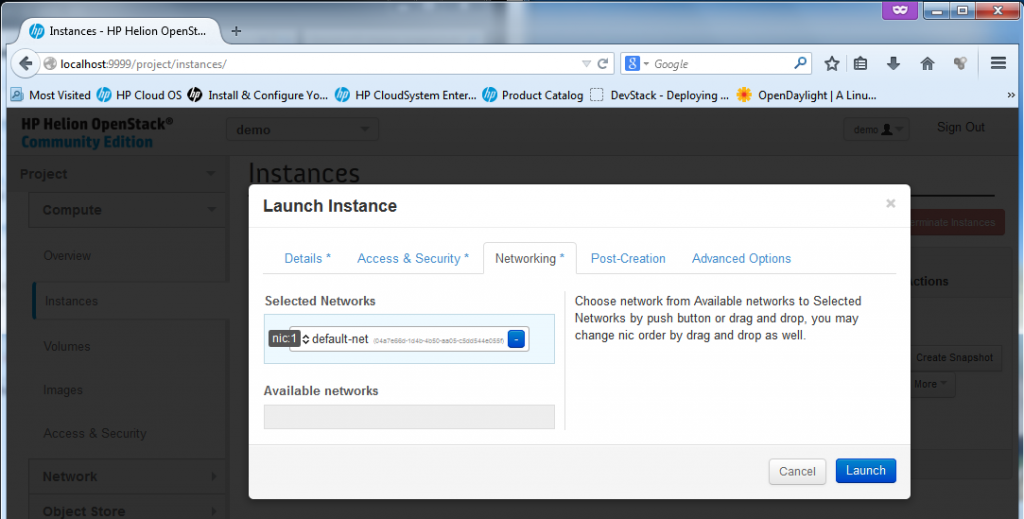
Part 3 – Launch Instance – Network interface

Last part that is worth mentioning  is Networking (because I will skip the “Post-Creation” and “Advanced Options” sections as uninteresting – really, these are for self-explanatory and I am currently not needing to go into them). In Networking you can choose the interfaces/subnets where your new VM should be connected to. Because we didn’t yet went into the Network section (this we will do in next section), I will only go with the default-net here.

Creating new Instance, part 3 - Network selection

Creating new Instance, part 3 – Network selection

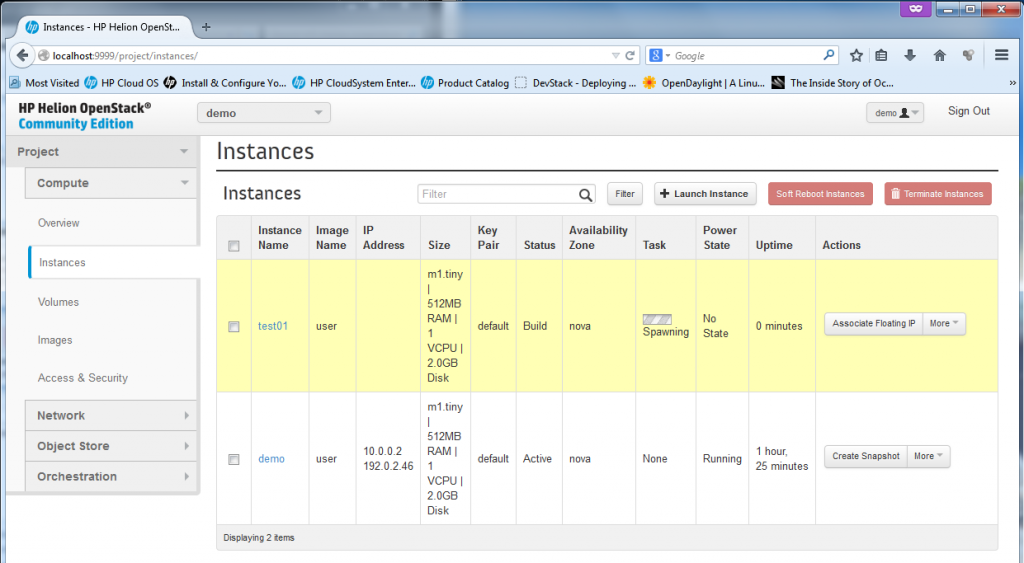
Part 4 – Launch Instance – Spawning new VM

Click “Launch”, the new VM will start to “spawn… ” for a while….

Creating new Instance, part 4 - spawning ...

Creating new Instance, part 4 – spawning …

Once the spawning finishes, the VM is ready, the state will just change to “Running” … but at this point, it will only have the default-net IP of 10.0.0.x, but no floating IP yet, but this is OK.

Creating new Instance, part 5 - new VM "test01" ready

Creating new Instance, part 4 – new VM “test01″ ready

On the console level, you can also check your instance exists, by going to the compute node (in my case the 192.0.2.22 – go back to Installation section, step #7 on how to find your compute node IP), the compute node is running KVM hypervisor so you can simply use the # virsh list command to list the instances, right now you should have there two instances created (first is the existing “demo” and the second one is the new “test01″. This is my example how I went there from the host system, first SSH is to the seed VM (because it has all the SSH keys) and then to the novacompute0 VM and changing to root (sudo su – is without password on cloud systems).

root@HPHelion1:~# ssh 192.0.2.1

<omitted>

root@hLinux:~# ssh heat-admin@192.0.2.22

<omitted>

$ sudo su -
root@overcloud-novacompute0-4r2q45kefrrm:~# virsh list
setlocale: No such file or directory
 Id    Name                           State
----------------------------------------------------
 2     instance-00000001              running
 4     instance-00000003              running

Part 5 – Launch Instance – Allocating and Associating a Floating IP with new VM (Optional step)

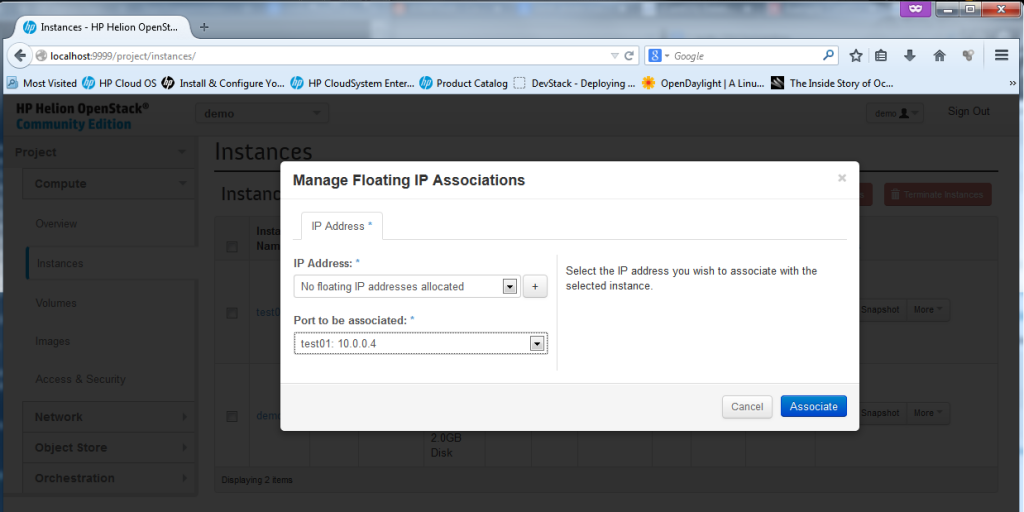
To assign a machine a floating IP, just go to the drop-down menu “More” and select “Associate Floating IP”. A small dialog will appear where you can select a port to associate with a new floating IP, select the “test01-10.0.0.4″, and hit the plus sign ” + ” to first allocate a new floating IP from a pool.

Creating new Instance, part 6 - floating IP dialog

Creating new Instance, part 5 – floating IP dialog
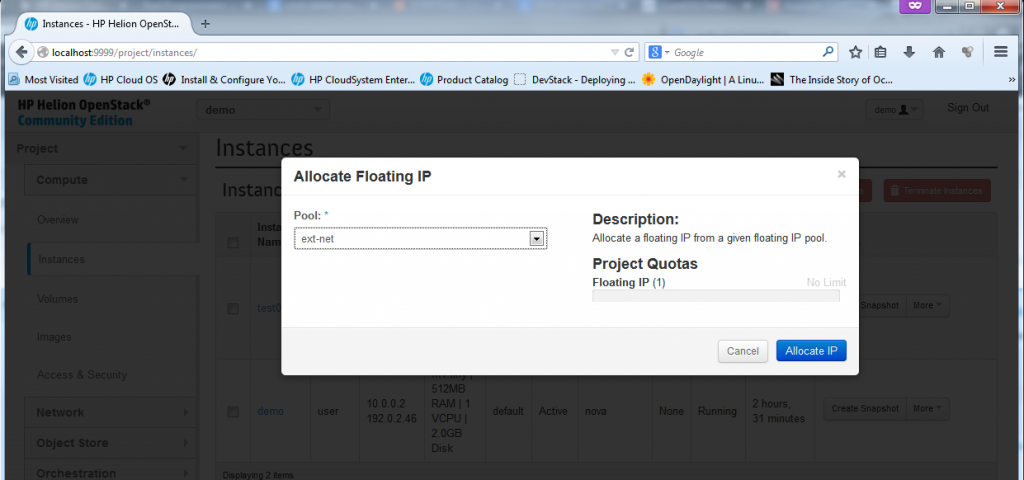
Creating new Instance, part 6 - allocate from a pool

Creating new Instance, part 5 – allocate from a pool
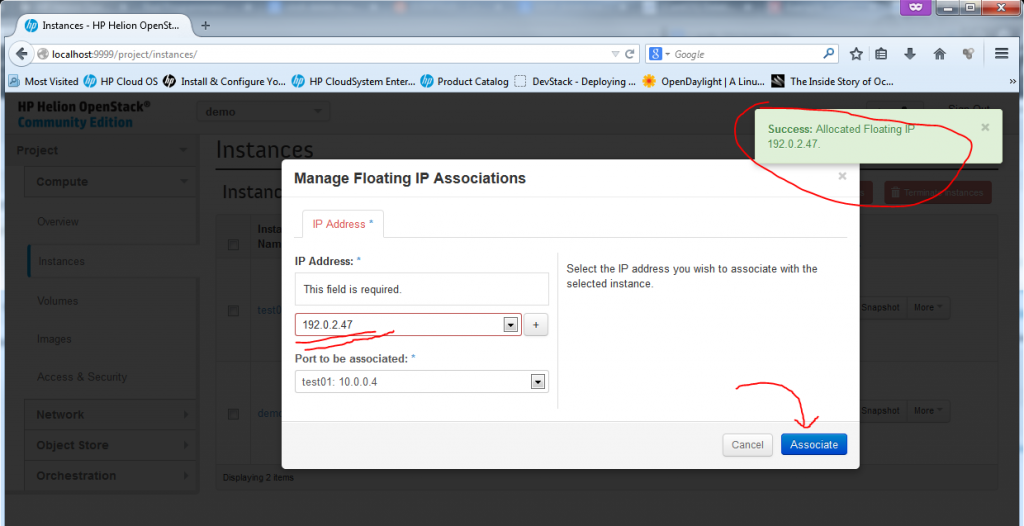
Creating new Instance, part 6 - Floating IP allocated, just hit "Associate"

Creating new Instance, part 5 – Floating IP allocated, just hit “Associate”

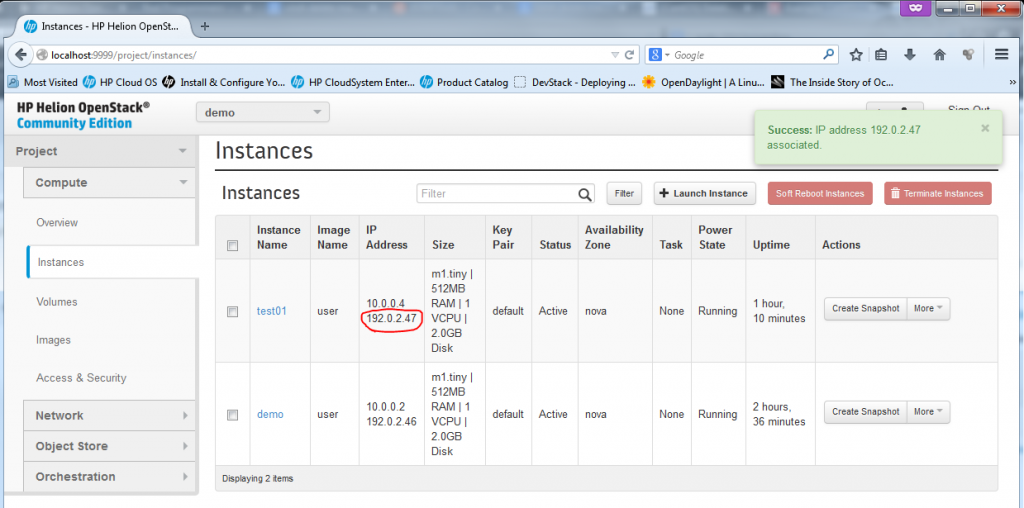
Now, the VM is fully finished (well, technically if the machine didn’t had to be accessible from “outside”, you could have skipped the floating IP part), but now we have a fully finished second VM we can play with.

Creating new Instance - FINAL

Creating new Instance – FINAL for “test01″, including new Floating IP

Verification of new Instance “test01″, access to console, network view

The basic test you can do if you have a floating IP is to ping it from the host ubuntu server, a quick ping should work.

root@HPHelion1:/home/zerxen# ping 192.0.2.47
PING 192.0.2.47 (192.0.2.47) 56(84) bytes of data.
64 bytes from 192.0.2.47: icmp_seq=1 ttl=62 time=9.08 ms
64 bytes from 192.0.2.47: icmp_seq=2 ttl=62 time=2.95 ms
64 bytes from 192.0.2.47: icmp_seq=3 ttl=62 time=2.17 ms
^C
--- 192.0.2.47 ping statistics ---
3 packets transmitted, 3 received, 0% packet loss, time 2001ms
rtt min/avg/max/mdev = 2.176/4.736/9.082/3.089 ms

For SSH access, on this point it is much more easy to go to the seed VM first, because this VM generated the keys, so you can jump from seed VM (hLinux) to all Helion VMs (both “demo” and new “test01″) without password because the private keys are exported.

root@HPHelion1:/home/zerxen# ssh 192.0.2.1
<omitted>
Last login: Sun Jun  8 15:57:53 2014 from 192.168.122.1
root@hLinux:~# ssh 192.0.2.47
The authenticity of host '192.0.2.47 (192.0.2.47)' can't be established.
ECDSA key fingerprint is 66:ac:fd:73:53:3e:1d:f6:db:e8:34:67:0f:46:cb:87.
Are you sure you want to continue connecting (yes/no)? yes
<omitted>
root@test01:~#

Of course, if you do not want to use the seed VM (hLinux) as jumpstation, just take the keys from its ~root/.ssh/ directory to the host system.

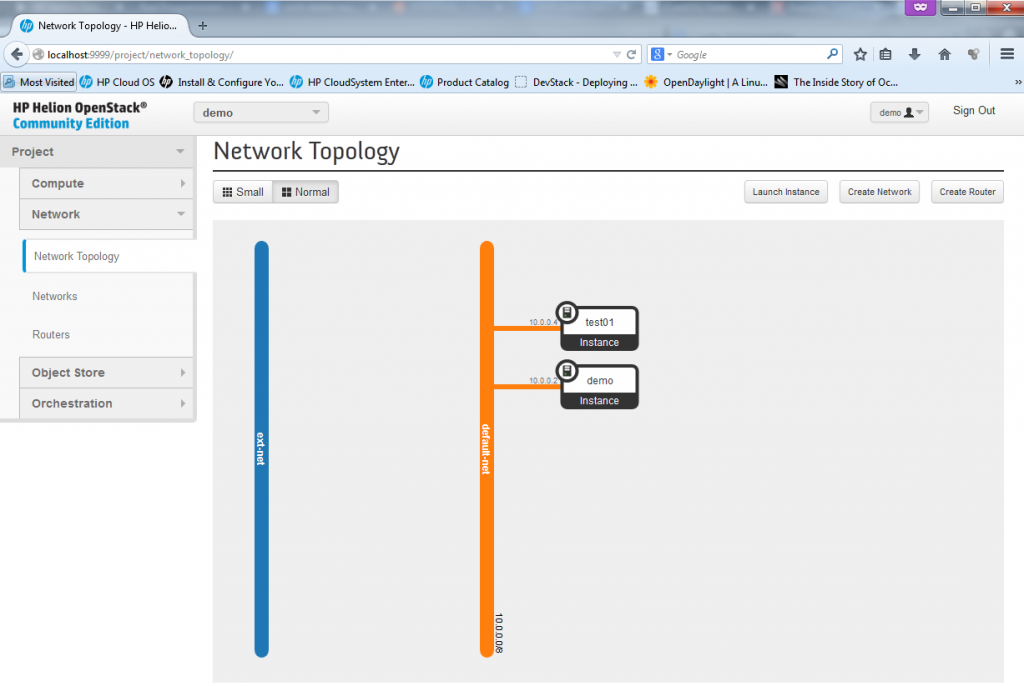
NOTE: You can also access the server using its 10.0.0.4 IP from a different servers inside the same subnet, so for example you can go to the “demo” VM and from it do an SSH towards 10.0.0.4, it will work just as normal because the two VMs are together part of the same subnet as shown below:

Network topology view on both "demo" and "test01" VMs sharing the same subnet

Network topology view on both “demo” and “test01″ VMs sharing the same subnet

Creating new Network

In this part, I will show how easy it is to setup additional network, we will create a new subnet with IP range 172.16.32.0/24 and then also in the following section create a router between the default-net and our new network.

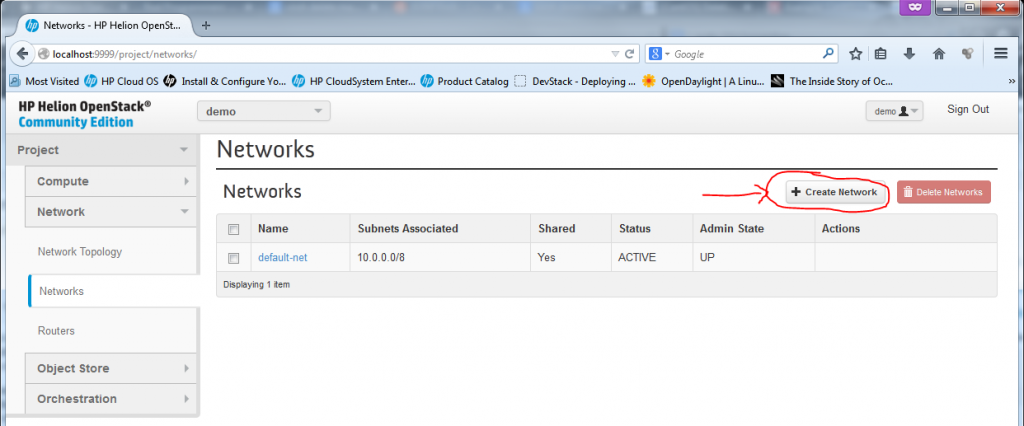
Part 1 – New Network – Open network creation dialog in Network -> Networks

Creating new Network, part 1 - Opening "New Network" dialog

Creating new Network, part 1 – Opening “Create Network” dialog

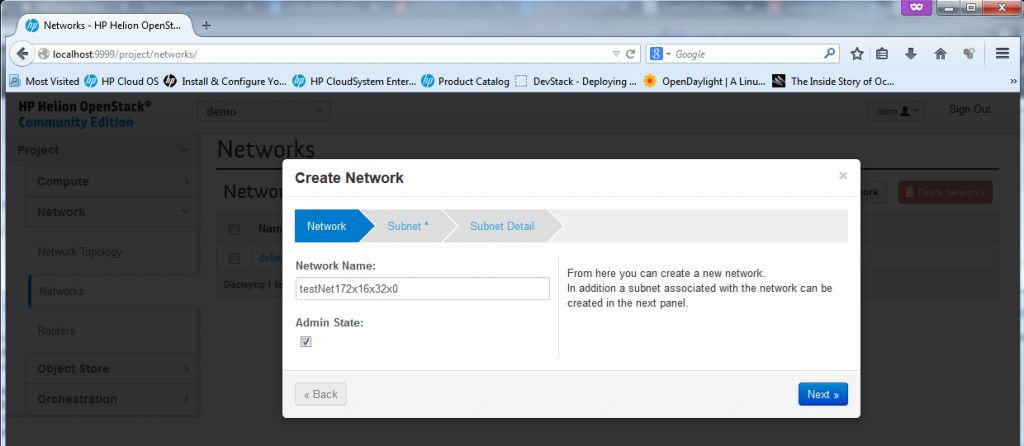
Part 2 – New Network – Give the new network a name

Creating new Network, part 2 - give the network a name

Creating new Network, part 2 – give the network a name

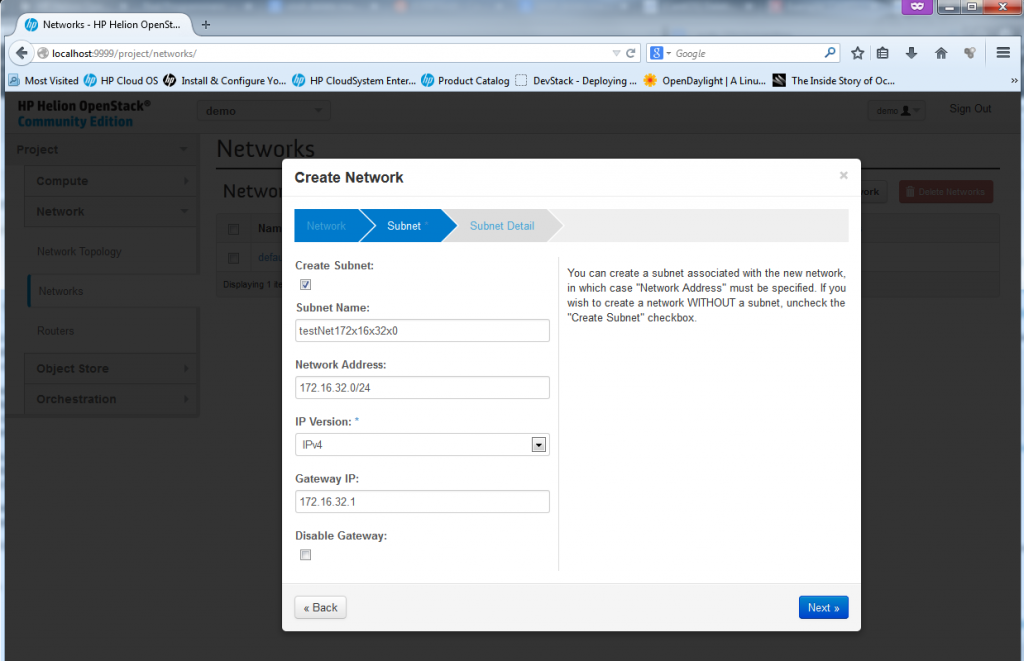
Part 3 – New Network – define the subnet/mask and optionally a default router/gateway

Creating new Network, part 3 - Define network subnet parameters

Creating new Network, part 3 – Define network subnet parameters

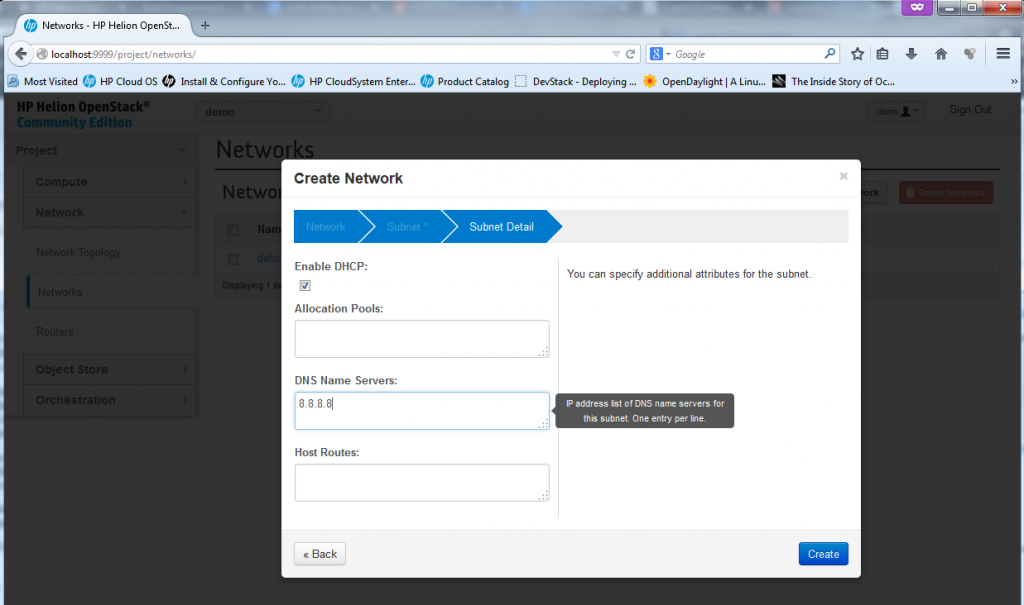
Part 4 – New Network – define DNS and other optional DHCP options

This is where you can define additional parameters like DNS and static routes, but for our use just add a DNS server if you have one in your LAB, or if you are using internet DNS like I am, I have used for LAB usage the google’s DNS on 8.8.8.8 (this is real Internet DNS, try it… ).

Creating new Network, part 4 - DNS/DHCP options

Creating new Network, part 4 – DNS/DHCP options

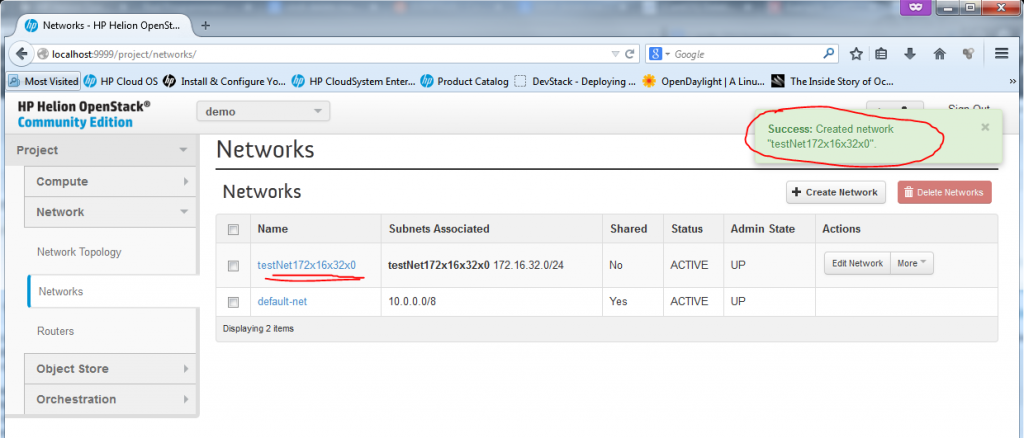
Part 5 – New Network – “was created”

Now the new network was created, and technically if you want you can already start putting new VMs/Instances with interfaces to this new network. At the moment, however, the new network is completelly disconnected from the other networks and we need a router to connect it.

Creating new Network, part 5 - new network was created (and is ready to be used)

Creating new Network, part 5 – new network was created (and is ready to be used)
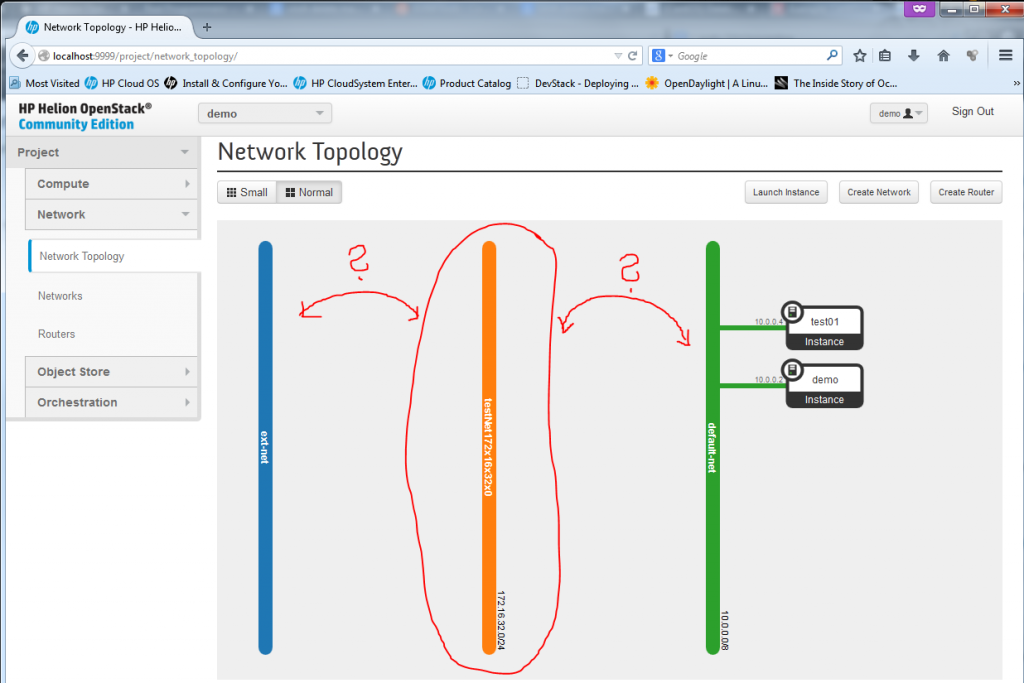
Creating new Network, part 5 - New network exists, but disconnected

Creating new Network, part 5 – New network exists, but disconnected

What we need now is a router to interconnect our new 172.16.32.0/24 subnet with the default-net (10.0.0.0/8) and ext-net (192.0.2.0/24). This is what we will do in the next section.

Creating New Router

It is quite silly how you can today create a virtual routers very simply, virtual routers are today used quite often in big server farms and this NFV (Network Function Virtualization) looks like is going to have a big success in cloud deployments. The obvious advantages for cloud are easy to imagine and having NFV functions technically moves cloud from their current “stupid server-farm” position to a really flexible environment where zones and DMZs is possible to create nearly instantly. I still cannot stop thinking about the high contrast between traditional typical DMZ orchestration project that usually takes 1-2 months and here you can have a functional DMZ in a few clicks. There are still things that need to get improved, for example, there is no Load-Balancer (or to be more exact, there is one in beta, but its capabilities are very limited in configuration scope).

But back on the task, creating a router in HP Helion, or OpenStack is quite easy, again just a few clicks via a dialog.

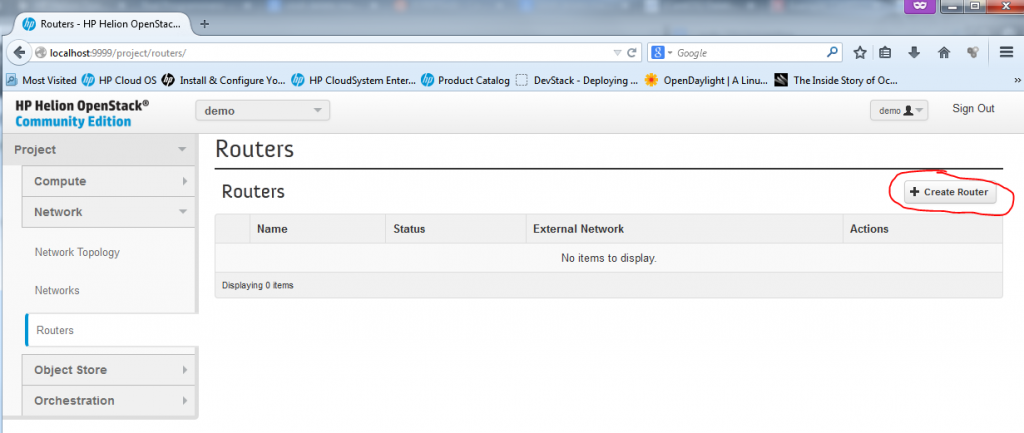
Part 1 – Creating New Router – starting the dialog and creating empty router “Test01_Router”

Creating new Router, part 1 - starting new router dialog

Creating new Router, part 1 – starting new router dialog
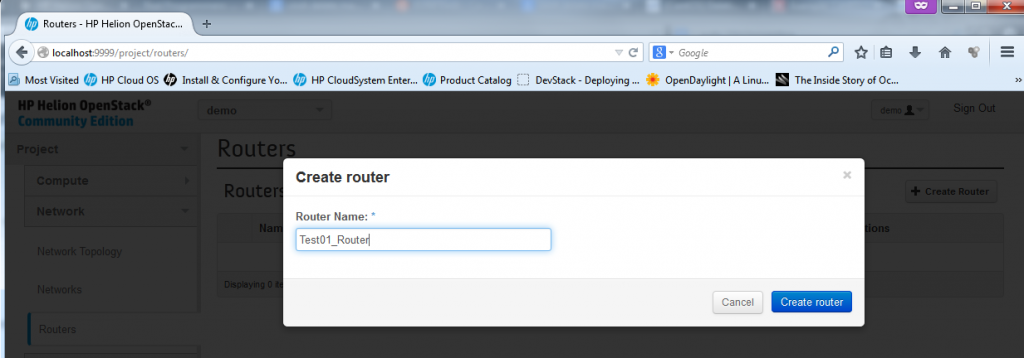
Creating new Router, part 1 - giving a name Test01_Router to new router

Creating new Router, part 1 – giving a name Test01_Router to new router

"Creating

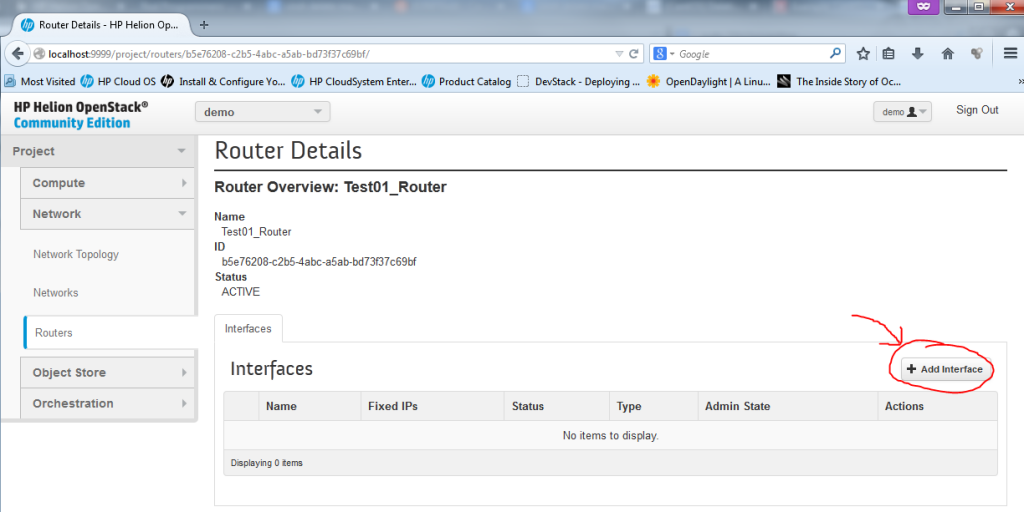
Part 2 – Create New Router – add interfaces to your router

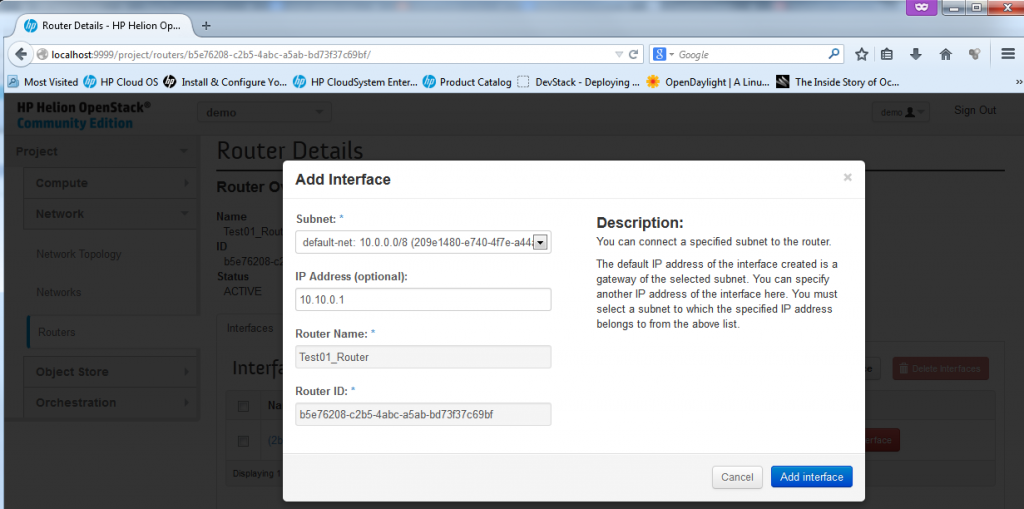
Now we need to add interfaces to the router, to do this, in the router configuration we opened by clicking on the router name, we can select “Add Interface”

Creating new Router, part 2 - Add Interface

Creating new Router, part 2 – Add Interface
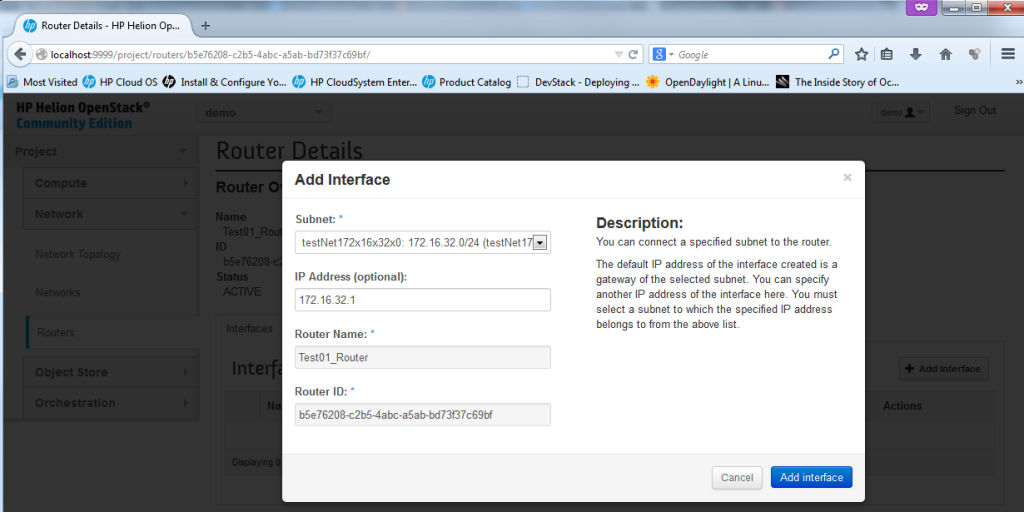
Creating new Router, part 2 - Select Network for new Interface

Creating new Router, part 2 – Select Network for new Interface – first the new 172.16.32.0/24

Creating new Router, part 2 - Define IP address to give to the router (if there is a collision, the system will stop you)

Creating new Router, part 2 – Define IP address to give to the router (if there is a collision, the system will stop you)

Part 3 – Create New Router – Interface for global/shared subnets like ext-net and default-net

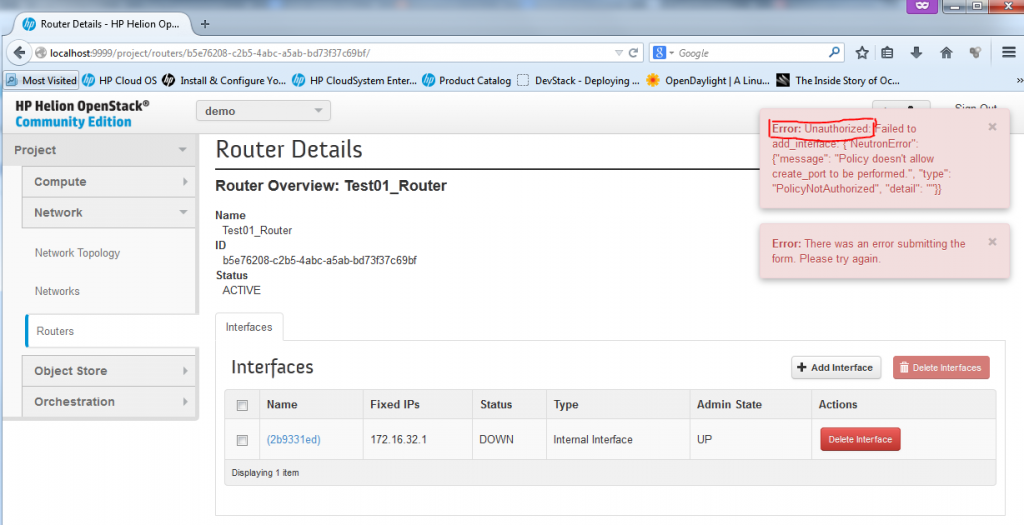
Unfortunately you cannot add interface towards the default subnets like the external ext-net and default-net because these are defined as common resource and only admin can add these, if you try to add an interface to the default-net 10.0.0.0/8 network, you will get the following error message:

Creating new Router, part 3 - Define IP in admin interface (will cause error)

Creating new Router, part 3 – Define IP in admin interface (will cause error)

Creating new Router, part 3 - Error when trying to add router interface to admin subnet

Creating new Router, part 3 – Error when trying to add router interface to admin subnet

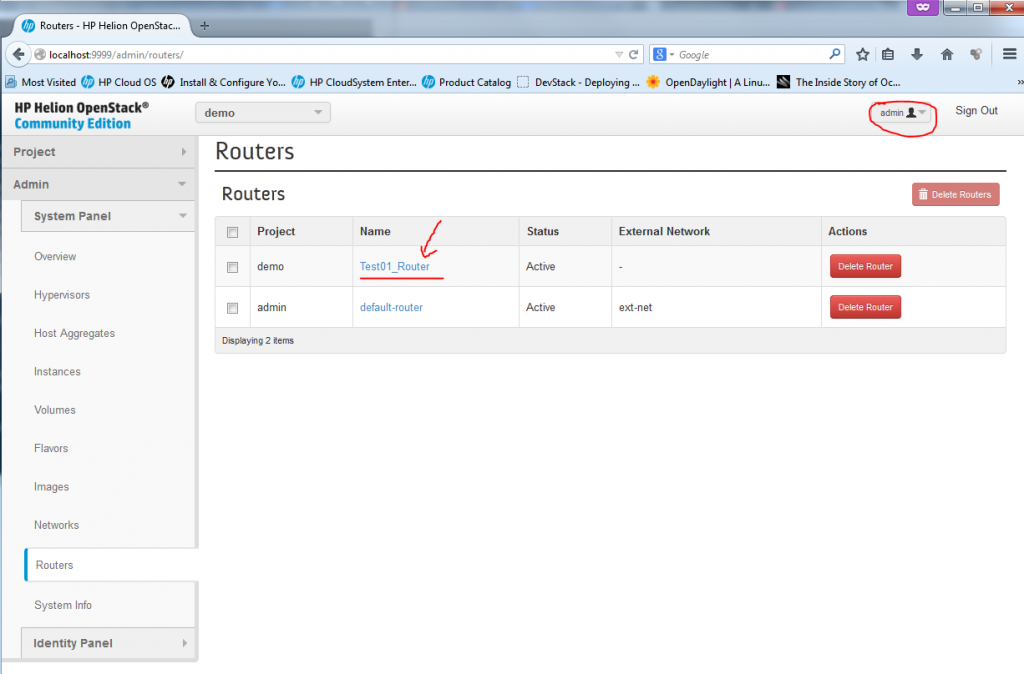
To avoid this issue, you have to add the interfaces as admin, so do a log-out, and login again as “admin” (The password you can get from reading your ~root/tripleo/tripleo-overcloud-passwords. and looking for OVERCLOUD_ADMIN_PASSWORD). In this admin mode, you can add router interface as intended.

Creating new Router, part 3 - Admin configuration of router

Creating new Router, part 3 – Admin configuration of router

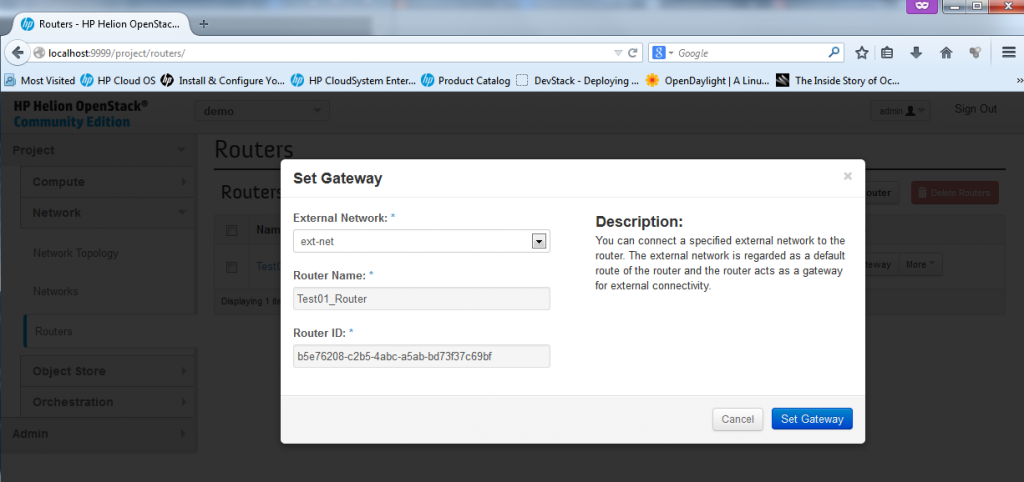
Part 4 – Create New Router – Adding Gateway (or ext-net) interface to a router

This is special, the ext-net network is very special in OpenStack and HP Helion, you cannot simply ad an interface for a router there, adding ext-net implicitelly means that the router has a default route (classical 0.0.0.0/0) to this network. NOTE: In fact, there is no routing configuration possible on these routers! The routers only know directly connected networks and can only route between them, with the only exception with the ext-net where the default route leads once added.

In the routers configuration, simply click on the “Set Gateway” button in the routers list.

Creating new Router, part 3 - Admin adding interface to a router

Creating new Router, part 4 – Admin adding interface to a router

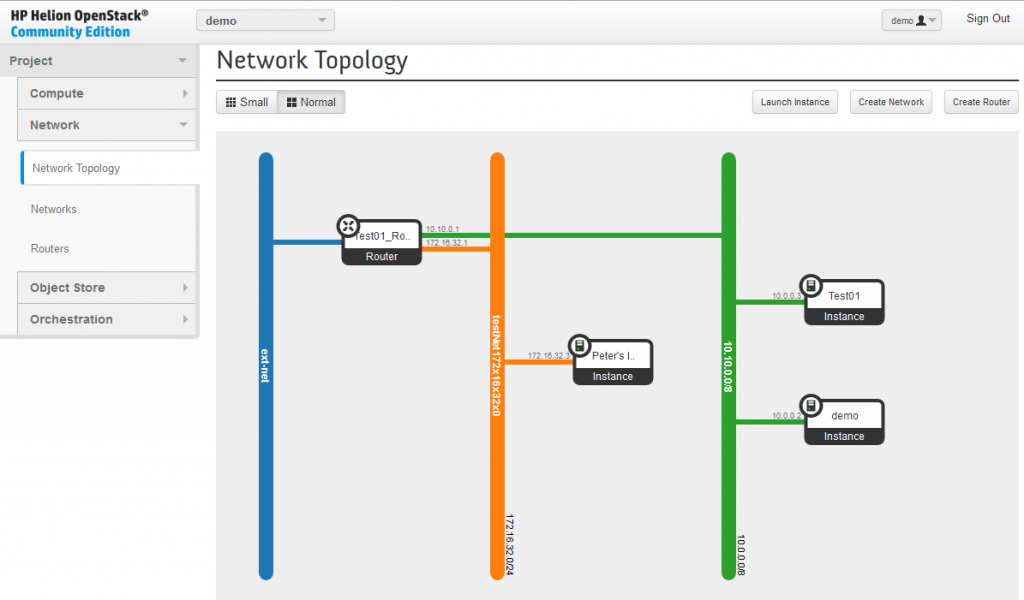
After this last step, you now have a new router that connectes both the default-net and your testNet172x16x32x0 to the outside network of ext-net and the network topology reflects this.

Creating new Router, part 4 - FINAL new router

Creating new Router, part 4 – FINAL new router

NOTE on replacing the default-router (created on installation) with your new test01_Router. If you want, you can delete the default-router from the system and use the new test01_Router instead, just be warned that you MUST remove all existing floating IPs (disassociate them from Instances), then delete the default-router and then you can again associate the IPs back to the Instances. This is because the FloatingIP to real IP NAT is happening on the default-router and you must do this process to move these.

OpenStack Network paths explanation

This I consider the best part of this article, because you are on “networkgeekstuff.com” I wanted to map how all this virtual networks are really forwarded on the network/server levels. And after quite extensive investigation, I now understand it. The HP Helion and the OpenStack components heavily rely on classical unix/linux bridging systems (if you worked with brctl or Open-vSwitch, then you will use these commands here often).  Technically these are the basic elemental logical points to keep in mind:

  1. The virtual “Networks” do not really exist, they are only linux “br-xxx” interfaces on the compute nodes where the individual machine Instances are executed and attached to the networks.
  2. If two Instances are placed to the same “Network” (means the same “Network” object and subnet like the default-net in our examples), then the compute node can do a bridge between these two Instances.
  3. The virtual routers and also NAT for FloatingIPs is done depending on where you install the neutron controller, what can be both inside the compute node, or independently on a difference barebone server and this server then becomes a “network node”. If the network node is independent, the traffic from individual Instances (and their compute nodes) has to be tunneled to the network node and routed there.
  4. Virtual networks between different physical notes, like in our example between the Compute node and Controller/Network node are transported by VXLAN tunnels. Each subnet gets it’s unique VXLAN Network Identifier (VNI) and technically in my example there were just two tunnels. But the important part here to notice is that each packets that needs to get transmitted between different subnets via virtual routers has to cross the VXLAN tunnel connection twice!

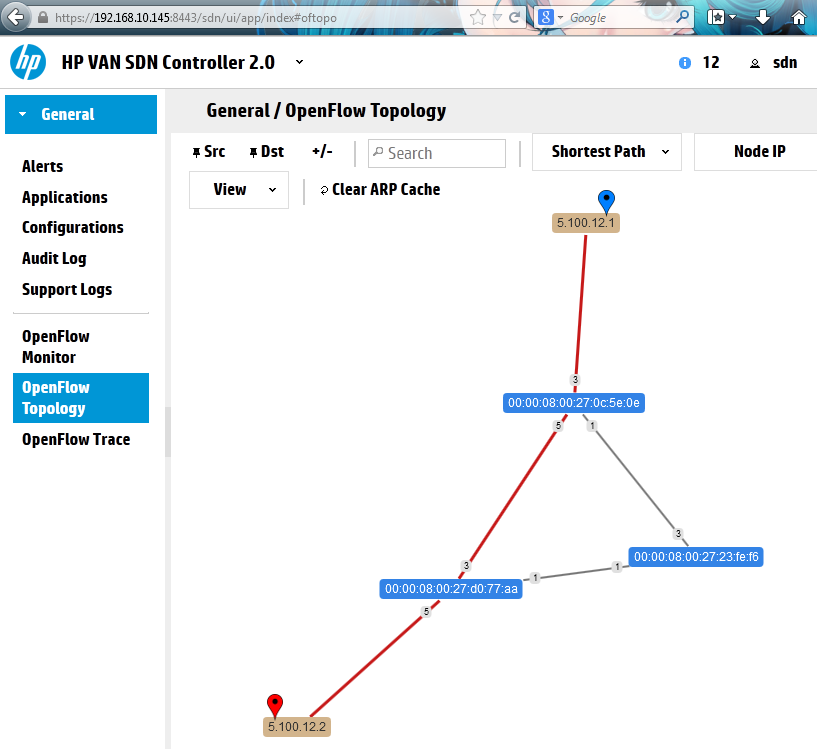
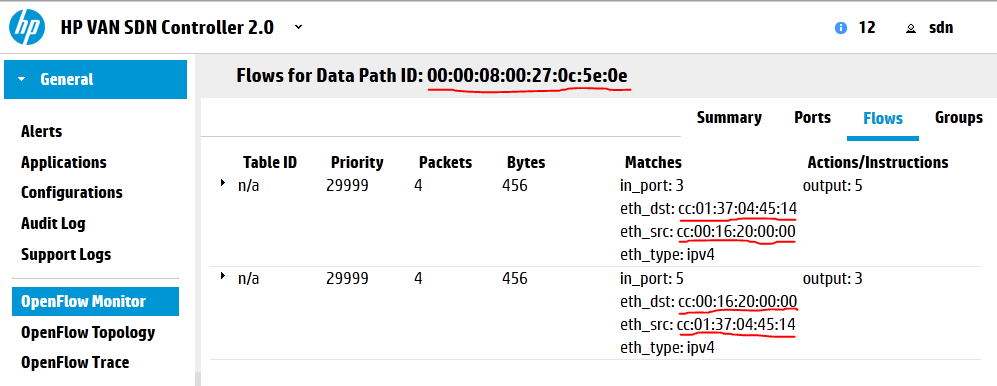
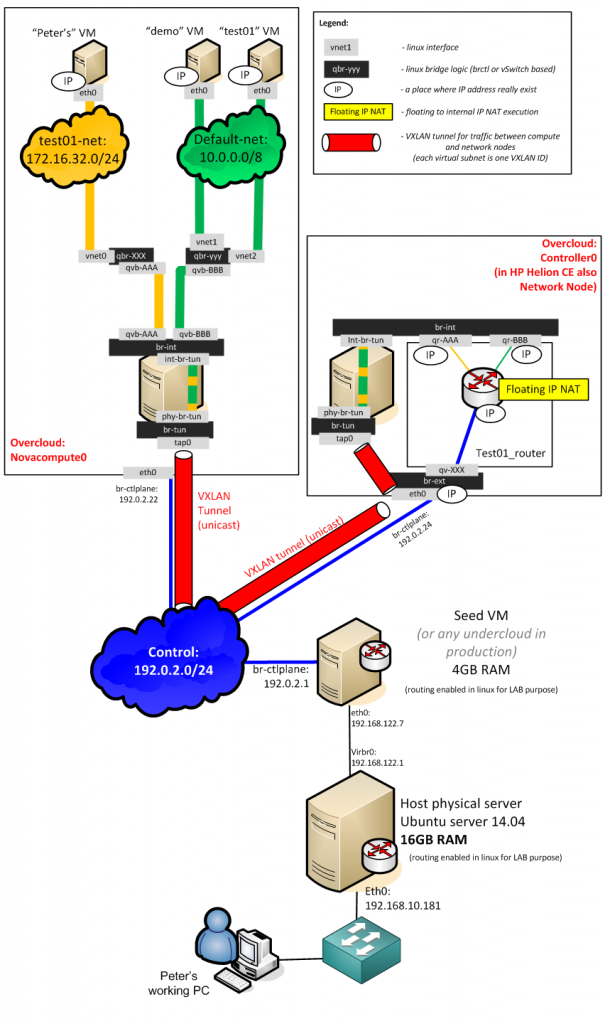
To support your understanding of the routing, I also did a quick capture. I have started a ping from both demo (10.0.0.2) and Test01 (10.0.0.3) towards “Peter’s Instance” (172.16.32.3). You can do a capture yourself on the internal network (on the host system, start capturing on all vnet0-4 interfaces), or here is a vnet3 PCAP capture from my test that shows the icmp ping packets. Note: to analyze VXLAN in wireshark, right click and select “Decode as.. ” and select “VXLAN”, wireshark will then analyze also the content of the VXLAN tunnel.

The picture below is showing the whole layer 2 bridged path a packets have to take to communicate either inside one network (default-net has two Instances for this), when crossing between networks (from test01-net to default-net, and reverse) and then from the Instance’s directly connected network (either default-net or test01-net) towards the public/control subnet where the NAT to floating IP is happening as well (click image to enlarge).

physical_network_forwarding

Summary and next-steps …

This is all that I have time to put down at the moment, in summary you now have installed the HP Helion, the HP flagship cloud based on OpenStack and did the essential steps to start using it “as if” a cloud. Just be warned that the HP Helion Community Edition is in NO WAY INTENDED FOR PRODUCTION USE! This comes from the fact that the system is running virtual-in-virtual, this means that on the one single required server, the TripleO is running 4x virtual machines that are “simulating” barebone servers and the OpenStack components like Control Node, Admin Node, Network Node and Compute Node are running virtualized. The Instances for end users are actually virtual machines running above Compute Node as virtual machines inside virtual machine of Compute Node, so this is not really how it should be in production. In real production, the OpenStack components (Control/Compute/Network/Storage/Admin) should all have a dedicated hardware (at least Compute and quite powerful one).  So in this regard the HP Helion CE is one step back in contrast to the older public release of HP Cloud OS, which at least basic real deployment.

Hopefully this all will change very soon, this year the HP Helion Enterprise edition should be out and this should provide us with much better LAB environment. For now the HP Helion CE stands as a nice and “quick&dirty” way how to play with the horizon gui, but cannot represent production grade system. If you need production level system, today you have to simply go to some other OpenStack system, or build a vanilla OpenStack environment yourself.

Additionally, the HP Helion Enterprise edition should come with some nice value added software from HP, so I will keep this on my own radar and expect to be reinstalling my LAB from HP Helion CE to the Enterprise edition as soon as available.

PS: This article was basic introduction to OpenStack, if I will have the time, I plan to put together part 2 of this article where we will have a look much deeper under the hood of OpenStack (including packet capture of VXLANs, routing in Network Node and much more).

References

Eycalyptus – cloud introduction and auto-scaling tutorial

$
0
0

For best article visual quality, open Eycalyptus – cloud introduction and auto-scaling tutorial directly at NetworkGeekStuff.

In this article, I will show how to do a very simple auto-scaling system on eucalyptus cloud using the wonderful eucalyptus fast start image. Afterwards you will appreciate how easy and configurable the Eucalyptus cloud is in regards to configuring customization scripts on systems that are booted dynamically inside auto-scaling triggers (like low CPU, RAM, etc… ).

A little history, last year (2014), HP has requisitioned a company called Eucalyptus, what I must admit surprised me after spending so much time with OpenStack. So I tried to get an idea why this move has happened and what are the main differences that immediately come to mind to compare these two.

So let me went with you on the first example exposure to Eucalyptus.

eucalyptus-logo… demo experience

Prerequisites:

  1. Physical system with Intel-V or AMD-x virtualization on CPU
  2. Virtual server running in hypervisor that supports nested virtualization (KVM or vmWare)

The target requirements

1)      Have a cloud system with capability to deploy a server quickly
2)      Test basic systems like load-balancing
3)      Check the network forwarding inside the cloud
4)      Demonstrate auto-scaling system of Eucalyptus on example server system

LAB IP setup

Dedicated vlan or switch with 192.168.128.0/24 with IPs as such:

192.168.125.1 – m0n0wall router
192.168.125.2 – My laptop system IP
192.168.125.3 – CentOS used for embedded eucalyptus deployment
192.168.125.10 – 55 : public IP range for instances
192.168.125.56 – 100 : private IP range for instances

My LAB basically is only running virtual using a wmWare workstation with two interfaces

vmnet0 (host-only network) – centOS6 with Eucalyptus

The virtual eucalyptus presentation server running CentOS and small virtual network on vmNet0 interface

The virtual eucalyptus presentation server running CentOS and small virtual network on vmNet0 interface

Step 1: installation package from eucalyptus

# mkdir ~root/eucalyptus
# cd ~root/eucalyptus
# bash <(curl -Ls eucalyptus.com/install)

First this is the install log, I do not want to go over the details as there are many interactive notes like this one that are simply too boring to note, but they show nicely.

NOTE: if you're running on a laptop, you might want to make sure that
you have turned off sleep/ACPI in your BIOS.  If the laptop goes to sleep,
virtual machines could terminate.

Continue? [Y/n]
Y

However there are more interesting parts to check:

[Precheck] OK, running a full update of the OS. This could take a bit; please wait.
To see the update in progress, run the following command in another terminal:

tail -f /var/log/euca-install-12.25.2014-18.10.45.log

What will be interesting for us during the wizard is setting the public and private IP ranges, in my lab I used these:

What's the first address of your available IP range?
192.168.125.10
What's the last address of your available IP range?
192.168.125.100
OK, IP range is good
  Public range will be:   192.168.125.10 - 192.168.125.55
  Private range will be   192.168.125.56 - 192.168.125.100

Then off-course on the question if we want the optional load balancers, the answer should always be YES as this is what we are interested in :)

Do you wish to install the optional load balancer and image
management services? This add 10-15 minutes to the installation.
Install additional services? [Y/n]

Step 2: Install complete

After the installation is complete, you will get something like this after an hour of looking at coffee:

) )     
    ( (    
  ........ 
  |      |]
  \      / 
   ------  


[Config] Enabling web console
EUARE_URL environment variable is deprecated; use AWS_IAM_URL instead
[Config] Adding ssh and http to default security group
GROUP   default
PERMISSION      default ALLOWS  tcp     22      22      FROM    CIDR    0.0.0.0/0
GROUP   default
PERMISSION      default ALLOWS  tcp     80      80      FROM    CIDR    0.0.0.0/0


[SUCCESS] Eucalyptus installation complete!
Time to install: 1:10:11
To log in to the Management Console, go to:
http://192.168.125.3:8888/

User Credentials:
  * Account: eucalyptus
  * Username: admin
  * Password: password

If you are new to Eucalyptus, we strongly recommend that you run
the Eucalyptus tutorial now:

  cd /root/cookbooks/eucalyptus/faststart/tutorials
  ./master-tutorial.sh

Thanks for installing Eucalyptus!


Step 3: Running the tutorials .. no, really, this thing has tutorials!

On this point I am fucking surprised that this thing is actually user friendly!

# cd /root/cookbooks/eucalyptus/faststart/tutorials
# ./master-tutorial.sh

Step3a: Listing tutorial

Gain login to eucalyptus

# source /root/eucarc

Then describe images:

# euca-describe-images
IMAGE   emi-2b9799cb    imaging-worker-v1/eucalyptus-imaging-worker-image.img.manifest.xml121804880595     available       private x86_64  machine                         instance-store     hvm
IMAGE   emi-dc054c35    loadbalancer-v1/eucalyptus-load-balancer-image.img.manifest.xml 121804880595       available       private x86_64  machine                         instance-store     hvm
IMAGE   emi-e70b2b70    default/default.img.manifest.xml        121804880595    available public   x86_64  machine                         instance-store  hvm

Now let’s import additional image of cloud Fedora from internet:

# curl http://mirror.fdcservers.net/fedora/updates/20/Images/x86_64/Fedora-x86_64-20-20140407-sda.raw.xz > fedora.raw.xz
# xz -d fedora.raw.xz

And install the image to the cloud with the following command. To install the image, we will run the following command:

# euca-install-image -n Fedora20 -b tutorial -i fedora.raw -r x86_64 --virtualization-type hvm

  -n Fedora20 specifies the name we're giving the image.
  -b tutorial specifies the bucket we're putting the image into.
  -i fedora.raw specifies the filename of the input image.
  -r x86_64 specifies the architecture of the image.
  --virtualization-type hvm means that we're using a native hvm image.

If I check now in the webGUI, there is a new image available called Fedora20.

WebGUI NOTE: Access to the webGUI is running on port 8888, so I will use my http://192.168.125.3:8888/ , the account is “eucalyptus“, username “admin” and password is “password“.

Eucalyptus WebGUI, new Fedora20 image loaded

Eucalyptus WebGUI, new Fedora20 image loaded

New, the tutorial will show you how to change this image from private to public (so that all cloud users can deploy it) and that can be achieved with this command:

# euca-modify-image-attribute -l -a all emi-0676ae2c

REMARK: There is a bug in the tutorial and the command there was missing the image ID.

You can see again the images also with the euca-describe-images command.

Now the last part is lauching an instance with the image, this can be simply done by this command:

# euca-run-instances -k my-first-keypair emi-0676ae2c

REMARK: By default there is already one instance running since installation that is eating 2GB of RAM. So your second instance may fail with euca-run-instances: error (InsufficientInstanceCapacity): Not enough resources, if this happens, go to the eucalyptus WebGUI and terminate the default instance:

Terminate default instance running since install!

Terminate default instance running since install!

If you are doing this via the tutorial, you will get a nice extra output like this:

# euca-run-instances -k my-first-keypair emi-0676ae2c

RESERVATION     r-77b206f8     121804880595   default 
INSTANCE       i-44cb070e     emi-0676ae2c   192.168.125.95 192.168.125.95 pending my-first-keypair   0               
m1.small       2014-12-25T22:08:22.122Z       default   monitoring-disabled     192.168.125.95 192.168.125.95                 
instance-store   hvm                     sg-dca36633                             x86_64

Capturing the instance ID
Capturing the public ip address
Waiting for your instance to start

1
2
3
4
5
6

Use this command to log into your new instance

# ssh -i ~/my-first-keypair.pem fedora@192.168.125.95

Step 3b: Missing more tutorials

The following tutorials are Available Now:
* Viewing available images, and understanding output
* Downloading and installing various cloud images
* Viewing running instances, and understanding output
* Launching an instance from an image

The following tutorials will be Coming Soon:
* Creating and mounting an EBS volume
* Creating a Boot-from-EBS image
* Using cloud-init to run commands automatically on a new instance
* Launching an instance and kicking off an automated application install
* Launching a hybrid install with AWS and Eucalyptus
* Adding a new Node Controller to increase cloud capacity
* ...and many more!

So what to do next ?

Step 4: With tutorials missing, let’s play independently

Now this is where fun starts, we have Eucalyptus, we have an image, but nothing much to do now as the tutorials are not yet really finished (December 2014/January 2015). So let’s try going independently and play around Eucalyptus. But I will not go into API or development of AWS in this tutorial, but I will go for the auto-scaling feature.

But first. lets mess around and get a feeling how to work with Eucalyptus a bit more, so lets list the basic commands for checking the eucalyptus without webGUI:

Prerequisite: Login to eucalyptus, which inside the faststart image you can do via provided source with this command:

source /root/aucarc

 euca-describe-images – shows all the system images loaded in the eucalyptus storage

# euca-describe-images
IMAGE   emi-0676ae2c    tutorial/fedora.raw.manifest.xml        121804880595    available       public  x86_64machine                          instance-store  hvm
IMAGE   emi-2b9799cb    imaging-worker-v1/eucalyptus-imaging-worker-image.img.manifest.xml      121804880595  available        private x86_64  machine                         instance-store  hvm
IMAGE   emi-dc054c35    loadbalancer-v1/eucalyptus-load-balancer-image.img.manifest.xml 121804880595    available      private x86_64  machine                         instance-store  hvm
IMAGE   emi-e70b2b70    default/default.img.manifest.xml        121804880595    available       public  x86_64machine                          instance-store  hvm

 euca-describe-keypairs – shows all the keypairs that eucalyptus has in storage (to use for the systems after launching the instance)

# euca-describe-keypairs
KEYPAIR my-first-keypair        54:f7:8e:6e:84:fb:bc:78:5e:38:42:f5:79:8e:9c:3a:93:75:23:70

euca-describe-groups – will show the FW rules for specific group, currently on the default one exists

# euca-describe-groups
GROUP   sg-dca36633     121804880595    default default group
PERMISSION      121804880595    default ALLOWS  tcp     22      22      FROM    CIDR    0.0.0.0/0       ingress
PERMISSION      121804880595    default ALLOWS  tcp     80      80      FROM    CIDR    0.0.0.0/0       ingress
PERMISSION      121804880595    default ALLOWS  icmp    -1      -1      FROM    CIDR    0.0.0.0/0       ingress

euca-describe-loadbalancing – will show the configured load-balancer groups

# euca-describe-loadbalancing
LOADBALANCING   API_192.168.125.3       API_192.168.125.3.loadbalancing 192.168.125.3                   ENABLED{}

euscale-describe-launch-configs – describes the configuration scripts for instances

# euscale-describe-launch-configs
LAUNCH-CONFIG   M1-SMALL-FEDORA emi-0676ae2c    m1.small

In addition please keep these commands in mind as these are the best commands to troubleshoot during this tutorial, but currently I give no example output because on this point in our tutorial there these are mostly empty.

euca-describe-instances

euca-describe-instance-status

euscale-describe-auto-scaling-groups

euwatch-describe-alarms

Step 5: Start preparations before auto-scaling (security groups)

Here we will create a security group called “Demo” that will allow basically the same things like the default group, but also 443 port. So in total icmp, TCP22, TCP80, TCP443.

# euca-create-group -d "Demo Security Group" DemoSG
GROUP   sg-49d47746     DemoSG  Demo Security Group
# euca-authorize -P icmp -t -1:-1 -s 0.0.0.0/0 DemoSG
GROUP   DemoSG
PERMISSION      DemoSG  ALLOWS  icmp    -1      -1      FROM    CIDR    0.0.0.0/0
# euca-authorize -P tcp -p 22 -s 0.0.0.0/0 DemoSG
GROUP   DemoSG
PERMISSION      DemoSG  ALLOWS  tcp     22      22      FROM    CIDR    0.0.0.0/0
# euca-authorize -P tcp -p 80 -s 0.0.0.0/0 DemoSG
GROUP   DemoSG
PERMISSION      DemoSG  ALLOWS  tcp     80      80      FROM    CIDR    0.0.0.0/0
# euca-authorize -P tcp -p 443 -s 0.0.0.0/0 DemoSG
GROUP   DemoSG
PERMISSION      DemoSG  ALLOWS  tcp     443     443     FROM    CIDR    0.0.0.0/0

if we now look again on all the security groups, we will see both the default and the new one (you can also double-check via webGUI)

# euca-describe-groups
GROUP   sg-49d47746     121804880595    DemoSG  Demo Security Group
PERMISSION      121804880595    DemoSG  ALLOWS  icmp    -1      -1      FROM    CIDR    0.0.0.0/0       ingress
PERMISSION      121804880595    DemoSG  ALLOWS  tcp     443     443     FROM    CIDR    0.0.0.0/0       ingress
PERMISSION      121804880595    DemoSG  ALLOWS  tcp     22      22      FROM    CIDR    0.0.0.0/0       ingress
PERMISSION      121804880595    DemoSG  ALLOWS  tcp     80      80      FROM    CIDR    0.0.0.0/0       ingress
GROUP   sg-dca36633     121804880595    default default group
PERMISSION      121804880595    default ALLOWS  tcp     22      22      FROM    CIDR    0.0.0.0/0       ingress
PERMISSION      121804880595    default ALLOWS  tcp     80      80      FROM    CIDR    0.0.0.0/0       ingress
PERMISSION      121804880595    default ALLOWS  icmp    -1      -1      FROM    CIDR    0.0.0.0/0       ingress

Step 6: Create a load-balancer

=====================================================================================
–OPTIONAL, BUT RECOMMENDED SECTION START–

Sometimes in the future, you will probably need to troubleshoot the load-balancer and for that you need access with SSH to the load-balancer instance. Now the problem is that by default Eucalyptus doesn’t give SSH keys to the load-balancer instances, so we need to do some steps to tell Eucalyptus to give these SSH keys where needed. So first generate a key with euca-create-keypair:

# euca-create-keypair euca-admin-lb > euca-admin-lb.priv
# chmod 0600 euca-admin-lb.priv

The the cloud property ‘loadbalancing.loadbalancer_vm_keyname’ governs the keypair assignments, so we modify it like this:

euca-modify-property -p loadbalancing.loadbalancer_vm_keyname=euca-admin-lb

— OPTIONAL, BUT RECOMMENDED SECTION END–
=====================================================================================

To create a load-balancer, we will use the eulb-create-lb command, the parameters are very simple at this point as we will only use the HTTP for load-balancing with default settings (more information about the settings can be found in the –help of the command, or on eucalyptus.com documentations)

# eulb-create-lb -z default -l "lb-port=80, protocol=HTTP, instance-port=80, instance-protocol=HTTP" DemoLB
DNS_NAME        DemoLB-121804880595.lb.localhost

You can also again check the load-balancer with eulb-describe-lbs

# eulb-describe-lbs
LOAD_BALANCER   DemoLB  DemoLB-121804880595.lb.localhost        2015-01-28T18:19:50.819Z

Every load-balancer needs a health-checking mechanism, this we can add using this command:

# eulb-configure-healthcheck --healthy-threshold 2 --unhealthy-threshold 2 --interval 15 --timeout 30 --target http:80/index.html DemoLB
HEALTH_CHECK    HTTP:80/index.html      15      30      2       2

The above command will create a load-balancer check that is checking an URL of /index.html every 15 seconds, failure of a test is after timeout of 30 seconds and two consecutive failures means server down and two consequent successful tests mean the server is back up.

Step 7: Server configuration scripts after booting (in auto-scaling)

If we want to do auto-scaling demo, the empty servers booting has to have some way to prepare the server after boot for real work. Because we are working here with HTTP servers, we need a small script, that will install apache2 server and configure a basic index.html webpage.

This is a script that we will use as part of a “launch-configuration” to do example configuration of a server instance after start:

#!/bin/bash
# 
# This small script will prepare a virtual image in eucalyptus to perform 
# as a small web server

# PART I.
# GET its own local identification

local_ipv4=$(curl -qs http://169.254.169.254/latest/meta-data/local-ipv4)
public_ipv4=$(curl -qs http://169.254.169.254/latest/meta-data/public-ipv4)
hostname=instance-${local_ipv4//./-}.networkgeekstuff.com
hostname $hostname

# PART II.
# Setup hosts
cat << EOF >> /etc/hosts
$local_ipv4   $hostname ${hostname%%.*}
EOF

# PART III.
# install apache
yum install -y httpd mod_ssl

# PART IV.
# configure apache to display a test page that will show our test message
cat << EOF >> /var/www/html/index.html
<!DOCTYPE html>
<html>
<head>
<title>Welcome networkgeekstuff.com eucalyptus demo system instance</title>
</head>
<body>
<h1>Welcome networkgeekstuff.com eucalyptus demo system instance</h1>

<p> You are visiting demo system configured by script from networkgeekstuff.com Eucalyptus tutorial </p>
<p> System ID is : $(hostname) </p>
</body>
</html>
EOF

# PART V.
# configure apache to start on boot
chkconfig httpd on
service httpd start

Tak this script and save it as a file /root/demo-lanuch-configuration-script.sh

Now lets take this script and make it part of a DemoLC launch configuration in eucalyptus with euscale-create-launch-config , we will use our Fedora20 image ID of emi-0676ae2c.

# euscale-create-launch-config DemoLC --image-id emi-0676ae2c --instance-type m1.small \
           --monitoring-enabled --key my-first-keypair --group=DemoSG \
           --user-data-file=/root/demo-lanuch-configuration-script.sh

Now have a look on the launch-configuration with euscale-describe-launch-configs, where our DemoLC is visible:

# euscale-describe-launch-configs
LAUNCH-CONFIG   DemoLC  emi-0676ae2c    m1.small
LAUNCH-CONFIG   lc-euca-internal-elb-121804880595-DemoLB-81abd4bf       emi-dc054c35    m1.small              loadbalancer-vm-121804880595-DemoLB
LAUNCH-CONFIG   M1-SMALL-FEDORA emi-0676ae2c    m1.small

Step 8: Creating the auto-scaling group

=====================================================================================
— OPTIONAL START: VERIFY YOU HAVE ENOUGH RESOURCES FOR MULTIPLE INSTANCES —

Before we go further I want to present to you something that was a problem for me when I was first attempting to create this auto-scaling system. My problem was that despite that I have enough RAM in my eucalyptus host (~8GB), I was not able to start more than 2 instances because of resource quotas and the auto-scaling was simply quietly failing in the background. Therefore you should first manually check if you can create at least 3 instances manually in the dashboard/webGUI (whe one running on 8888 port).

You can either start creating new instances via the webGUI interface and wait until you hit this error:

Eucalyptus resource limit error after unsuccessful instance launch.

Eucalyptus resource limit error after unsuccessful instance launch.

The problem that I had was that I had enough RAM, definitely enough to have several t1.small instances (256MB RAM each) running, but something was blocking me, what I found out was that each eucalyptus node (ergo server registered in the control system as place capable of hosting instances) has a quota limits that can be viewed with euca-describe-availability-zones verbose command. This is what I got when I had my problems:

# euca-describe-availability-zones verbose
AVAILABILITYZONE        default 192.168.125.3 arn:euca:eucalyptus:default:cluster:default-cc-1/
AVAILABILITYZONE        |- vm types     free / max   cpu   ram  disk
AVAILABILITYZONE        |- m1.small     0000 / 0001   1    256     5
AVAILABILITYZONE        |- t1.micro     0000 / 0001   1    256     5
AVAILABILITYZONE        |- m1.medium    0000 / 0001   1    512    10
AVAILABILITYZONE        |- c1.medium    0000 / 0000   2    512    10
AVAILABILITYZONE        |- m1.large     0000 / 0000   2    512    10
<<omitted>>

Notice the free and max columns, this is the maximum amount of instances your eucalyptus node will allow you to launch! And 1 instance maximum is definitely not enough for an auto-scaling tutorial we are running here. So here is how to extend this limit, but note that your are responsible for managing your own RAM limits when you do this.

EDIT file /etc/eucalyptus/aucalyptus.conf and look for a parameter “MAX_CORES=0“.  And increase the value, afterwards restart the eucalytus process with # service eucalyptus-cloud restart or  # service eucalyptus-nc restart reboot.

I for example changed MAX_CORES=4 and as such I get the following availabilities in the cloud:

# euca-describe-availability-zones verbose
AVAILABILITYZONE        default 192.168.125.3 arn:euca:eucalyptus:default:cluster:default-cc-1/
AVAILABILITYZONE        |- vm types     free / max   cpu   ram  disk
AVAILABILITYZONE        |- m1.small     0004 / 0004   1    256     5
AVAILABILITYZONE        |- t1.micro     0004 / 0004   1    256     5
AVAILABILITYZONE        |- m1.medium    0002 / 0002   1    512    10
AVAILABILITYZONE        |- c1.medium    0002 / 0002   2    512    10
AVAILABILITYZONE        |- m1.large     0002 / 0002   2    512    10
AVAILABILITYZONE        |- m1.xlarge    0002 / 0002   2   1024    10
AVAILABILITYZONE        |- c1.xlarge    0002 / 0002   2   2048    10
AVAILABILITYZONE        |- m2.xlarge    0002 / 0002   2   2048    10
AVAILABILITYZONE        |- m3.xlarge    0001 / 0001   4   2048    15
AVAILABILITYZONE        |- m2.2xlarge   0000 / 0000   2   4096    30

— OPTIONAL END: VERIFY YOU HAVE ENOUGH RESOURCES FOR MULTIPLE INSTANCES —
=====================================================================================

Now we are going to prepare a auto-scaling group that will be driving starting and shutdowns of server as needed, the command used is euscale-create-auto-scaling-group and we will reference both the load-balancer DemoLB and the launch-configuration DemoLC we created in previous steps.

# euscale-create-auto-scaling-group DemoASG --launch-configuration DemoLC \
             --availability-zones default --load-balancers DemoLB \
             --min-size 1 --max-size 3 --desired-capacity 1

You can again then verify the auto-scaling groups existence with euscale-describe-auto-scaling-groups command as below:

# euscale-describe-auto-scaling-groups
AUTO-SCALING-GROUP      DemoASG DemoLC  default DemoLB  1       3       1       Default
AUTO-SCALING-GROUP      asg-euca-internal-elb-121804880595-DemoLB       lc-euca-internal-elb-121804880595-DemoLB-81abd4bf      default         1       1       1       Default
INSTANCE        i-b764ff79      default InService       Healthy lc-euca-internal-elb-121804880595-DemoLB-81abd4bf

Step 9: Creating scaling-policy for both increase and decrease of instance counts

With the following command euscale-put-scaling-policy we will define a policy for changing scaling capacity based, as name suggest we will in the second step make this policy behavior based on CPU alarms.

# euscale-put-scaling-policy DemoHighCPUPolicy --auto-scaling-group DemoASG --adjustment=1 --type ChangeInCapacity
arn:aws:autoscaling::121804880595:scalingPolicy:4952e021-f20d-4180-a971-8de31dcbe610:autoScalingGroupName/DemoASG:policyName/DemoHighCPUPolicy

Now the second part is to create and alarm and monitor the CPU usage, for that we will use the euwatch-put-metric-alarm command, and at the end in the –alarm-action we will use the auto-scale policy ID from the previous command.

# euwatch-put-metric-alarm DemoAddNodesAlarm --metric-name CPUutilization \
--unit Percent --namespace "AWS/EC2" --statistic Average --period 120 --threshold 50 \
--comparison-operator GreaterThanOrEqualToThreshold --dimensions "AutoScalingGroupName=DemoASG" --evaluation-periods 2 \
--alarm-action arn:aws:autoscaling::121804880595:scalingPolicy:4952e021-f20d-4180-a971-8de31dcbe610:autoScalingGroupName/DemoASG:policyName/DemoHighCPUPolicy

NOW WE REPEAT THESE STEP WITH DIFFERENT PARAMETERS TO CREATE SCALE-DOWN POLICY

The differences are:
DemoDelNodesAlarm (changed name)
— adjustment = -1 (to have a decrease in number of instances)
— threshold 10   (to check when CPU utilization on instance is below 10%)
–comparison-operator LessThanOrEqualToThreshold (to check below the 10% CPU threshold)

# euscale-put-scaling-policy DemoLowCPUPolicy --auto-scaling-group DemoASG --adjustment=-1 --type ChangeInCapacity
arn:aws:autoscaling::121804880595:scalingPolicy:784c3b5a-17ef-4cbe-9743-4d55623c8faa:autoScalingGroupName/DemoASG:policyName/DemoLowCPUPolicy

# euwatch-put-metric-alarm DemoDelNodesAlarm --metric-name CPUutilization \
--unit Percent --namespace "AWS/EC2" --statistic Average --period 120 --threshold 10 \
--comparison-operator LessThanOrEqualToThreshold --dimensions "AutoScalingGroupName=DemoASG" --evaluation-periods 2 \
--alarm-action arn:aws:autoscaling::121804880595:scalingPolicy:784c3b5a-17ef-4cbe-9743-4d55623c8faa:autoScalingGroupName/DemoASG:policyName/DemoLowCPUPolicy

Step 10: Creating a termination policy

One thing that we omitted in the previous scale-down policy is to say which instance should be terminated from the group of instances running. At this moment we will simply choose one of the pre-set options that is called OldestLaunchConfiguration. This method will during scale-down policy shutdown that instance, that has the oldest version of configuration script from Step 7 (ergo it is expected that you will update these scripts over time).

# euscale-update-auto-scaling-group DemoASG --termination-policies "OldestLaunchConfiguration"

REMARK: This method actually has one additional use-case, imagine that you are doing an application update (for example new version of webpage rolled out to the instances), for something like this you can modify the server configuration script from Step 7 and then just increasing the load will launch a new auto-scaled instance with new webpage and after a while, when the system will be scaling-done the instance cluster, it will shutdown specifically those servers that are running with the oldest version of the server configuration script. This way you can technically do a rolling updates across all your instances as a “trick”.

Step 11: Verification that auto-scaling is running the first instance

Ok, so everything is actually configured, now the auto-scaling group should have already created the initial instance. On this point I will show the webGUI view on the running instances, but I really recommend you to re-run all the commands from Step 4 to give yourself the full view on how the auto-scaling and instance status looks like from the console commands perspective.

If you go to webGUI, then immediatelly enter the “SCALING-GROUPS” view and you will see two groups exist, one is internal system for load-balancer resouces, which is a result of your DemoLB, but you do not have to care about this, the second however is your DemoASG and you should see the number of instances on 1! This is the view:

DemoASG showing the initial instance running!

DemoASG showing the initial instance running!

Next we will check the details, select the gear icon and select View details

1_auto_scaling

In this view, select “Instances” tab and you should see your auto-scaled instance ID i-db9ead12:

Detail of the initial instance ID

Detail of the initial instance ID

Now that we have our ID, lets go check the instance details in the main view “Instances” view (go back to dashboard and select Running instances there):

Finding our auto-scaled instance via ID in the running instance list (note the IP address)

Finding our auto-scaled instance via ID in the running instance list (note the IP address)

Ok, now we have an IP address, lets go connect to it! If you followed my steps from the beginning, you should have the my-first-keypair.pem file in the /root directory. So you can use it to connect to the fedora image like this:

# ssh -i ./my-first-keypair.pem fedora@192.168.125.53
Last login: Wed Jan 28 22:14:20 2015 from 192.168.125.53
[fedora@instance-192-168-125-74 ~]$

Immediatelly please notice that the hostname of the target system is “instance-192-168-125-74″ what means that our configuration script has worked!!! Maybe it will take some time to finish the whole configuration (like apache2 installation), but lets check if the HTTP service is running already with the netstat command.

[fedora@instance-192-168-125-74 ~]$ sudo netstat -tl
Active Internet connections (only servers)
Proto Recv-Q Send-Q Local Address           Foreign Address         State
tcp        0      0 0.0.0.0:ssh             0.0.0.0:*               LISTEN
tcp6       0      0 [::]:http               [::]:*                  LISTEN
tcp6       0      0 [::]:ssh                [::]:*                  LISTEN
tcp6       0      0 [::]:https              [::]:*                  LISTEN

As you can see, HTTP is running, so lets point our browser to it (using either the internal 192.168.125.53 OR the external 192.168.125.74 IP) and check what we will find:

Access to instance working, including configuration script that configured a webpage!

Access to instance working via 192.168.125.53 (internal IP), including configuration script that configured a webpage!

Access to instance working via 192.168.125.74 (external IP), including configuration script that configured a webpage!

Access to instance working via 192.168.125.74 (external IP), including configuration script that configured a webpage!

Now also you should check the access via the load-balancer, if everything works, you should also via the load-balancer, first check the IP of the load-balancer via the webGUI, go to Running instances again and select details of the load-balancer instance running.

Load-Balancer instance public 192.168.125.17 and private 192.168.125.71 IPs

Load-Balancer instance public 192.168.125.17 and private 192.168.125.71 IPs

So to test access, point your browser also to the public IP of the load-balancer that is the 192.168.125.71 and you should see access to one of the running instances, in this case only the one 192.168.125.74:

Access to instance 192.168.125.74 web service VIA load-balancer with public IP 192.168.125.71

Access to instance 192.168.125.74 web service VIA load-balancer with public IP 192.168.125.71

BONUS Step if not working: Troubleshooting load-balancer if needed.

When I have tried accessing the test webpage via Load-Balancer for the first time, it was not working, after double-checking everything I concluded that something must be wrong with the Eucalyptus Load-Balancers used in the auto-scaling. But how to troubleshoot this ? Well the point is that from the eucalyptus system, you can only check how the load-balancer considers the server HTTP system alive or not with the eulb-describe-instance-health command. This was specifically my problem, the server (despite running HTTP and test page) was considered “OutOfService”.

# eulb-describe-instance-health DemoLB
INSTANCE        i-7ddcfe12      OutOfService

Ok, so we need to check the load-balancer operation, and for that we need to enter it. First list out the instances and look for the load-balancer, in the webGUI you can find the loadbalancer in the running instances, and select detailed view:

load-balancer instance SSH access details

load-balancer instance SSH access details

Notice the Instance ID of i-b5d6412a in the GUI, we can find this also in the console instances view:

# euca-describe-instances
RESERVATION     r-4d06d56c      121804880595    euca-internal-121804880595-DemoLB
INSTANCE        i-b5d6412a      emi-dc054c35    192.168.125.92  192.168.125.92  running     euca-admin-lb         m1.small        2015-01-29T08:02:55.934Z        default                         monitoring-enabled      192.168.125.92       192.168.125.92                  instance-store                                  hvm             cde4677e-a6c6-4eee-8f8f-a2a95e54a9ad_default_1  sg-0c984bf7                     arn:aws:iam::121804880595:instance-profile/internal/loadbalancer/loadbalancer-vm-121804880595-DemoLB x86_64
TAG     instance        i-d4cea9f5      Name    loadbalancer-resources
TAG     instance        i-d4cea9f5      aws:autoscaling:groupName       asg-euca-internal-elb-121804880595-DemoLB
TAG     instance        i-d4cea9f5      euca:node       192.168.125.3

Right behind the “running” word is the key pair that the load-balancer instance is using, which is of course the euca-admin-lb that the created Step 6 optional section. If you didn’t done this, you probably see “0” instead of key and this means that there is no SSH keypair deployed in the load-balancer and you cannot connect there now! However if you have done the optional part of Step 6, you can now connect to the loadbalancer with SSH like this:

# ssh -i euca-admin-lb.priv root@192.168.125.17

Once inside the load-balancer, the main cause for me was the NTP not synchronized.

Here are the LOGs : /var/log/load-balancer-servo/servo.log , my error that pointed me to NTP was:

servo [ERROR]:failed to report the cloudwatch metrics: [Errno -2] Name or service not known

Step 12: Verify the auto-scaling work with CPU stress tests

Now we have the auto-scaling configured, we have policy to increase and to decrease the number of instances based on CPU load, so lets test it. Right now our group has a minimum running instances of 1, lets try to push it to 2 with loading the CPU a little bit up.

To have a tool to push CPU usage up, install “stress” to the

# yum install -y stress

Now, have a look on the auto-scaling group in the webGUI, there is a default cooldown period in seconds between scaling events, therefore we must product a CPU usage above 50% cpu for more than 300 seconds in order to have a trigger.  And for that we use the stress tool like this (running from inside the instance):

# stress -c 4 -t 600

This will generate a CPU load inside the instance that should trigger a scaling event.

top - 18:19:08 up 53 min,  2 users,  load average: 101.24, 85.11, 45.10
Tasks: 174 total, 102 running,  72 sleeping,   0 stopped,   0 zombie
%Cpu(s):  0.0 us,  0.0 sy,  0.0 ni,  0.0 id,  0.0 wa, 98.0 hi,  0.0 si, 95.0 st
KiB Mem:    245364 total,   240940 used,     4424 free,     7808 buffers
KiB Swap:        0 total,        0 used,        0 free,   124428 cached

  PID USER      PR  NI    VIRT    RES    SHR S %CPU %MEM     TIME+ COMMAND                             
  866 root      20   0    7268     92      0 R  23.6  0.0   0:00.75 stress                              
  867 root      20   0    7268     92      0 R  23.6  0.0   0:00.75 stress                              
  868 root      20   0    7268     92      0 R  23.6  0.0   0:00.75 stress                              
  869 root      20   0    7268     92      0 R  23.6  0.0   0:00.75 stress

Alternative, if stress is not generating enough CPU load is to use superPi or for 64bit only linux then this version of y-cruncher pi

Watching the triggers and alarms status:

# euwatch-describe-alarms
DemoAddNodesAlarm       OK       arn:aws:autoscaling::121804880595:scalingPolicy:087c4635-6bed-4578-af94-1a167479a4ae:autoScalingGroupName/DemoASG:policyName/DemoHighCPUPolicy      AWS/EC2 CPUutilization  120     Average 2       GreaterThanOrEqualToThreshold   20.0
DemoDelNodesAlarm       OK       arn:aws:autoscaling::121804880595:scalingPolicy:fa7de436-5548-4791-9c18-6ef73fb4b375:autoScalingGroupName/DemoASG:policyName/DemoLowCPUPolicy       AWS/EC2 CPUutilization  120     Average 2       LessThanOrEqualToThreshold      10.0

Specifically if you want history of the data that the alarms use as “input” you can go directly for the metric for CPUutilization like this

# euwatch-get-stats -n AWS/EC2 -s Average --period 120 --dimensions "AutoScalingGroupName=DemoASG" CPUUtilization 
2015-01-31 16:50:00             0.7666666666666666                              Percent
2015-01-31 16:52:00             0.7350993377483444                              Percent
2015-01-31 16:54:00             0.7248322147651006                              Percent
2015-01-31 16:58:00             2.2333333333333334                              Percent
2015-01-31 17:00:00             6.119205298013245                               Percent
2015-01-31 17:04:00             21.381270903010034                              Percent
2015-01-31 17:08:00             0.8400000000000001                              Percent
2015-01-31 17:10:00             4.523178807947019                               Percent
2015-01-31 17:12:00             43.50666666666667                               Percent
2015-01-31 17:14:00             41.463087248322154                              Percent
2015-01-31 17:18:00             33.01324503311258                               Percent
2015-01-31 17:20:00             36.28                           Percent
2015-01-31 17:22:00             4.3892617449664435                              Percent
2015-01-31 17:24:00             8.920529801324504                               Percent
2015-01-31 17:28:00             11.355704697986576                              Percent
2015-01-31 17:30:00             3.4172185430463577                              Percent
2015-01-31 17:32:00             3.0134228187919465                              Percent
2015-01-31 17:34:00             33.81456953642384                               Percent
2015-01-31 17:38:00             8.080536912751677                               Percent
2015-01-31 17:40:00             23.2317880794702                                Percent

Worst case scenario if you have problem triggering the alarms, you can do it manually like this by setting the alarm state to “ALARM”:

euwatch-set-alarm-state --state-value ALARM --state-reason Testing DemoAddNodesAlarm

If successful, you will see two INSTANCES,one old and one new that was launched under the auto-scaling group:

Auto scaling group triggered INSTANCE increase to 2

Auto scaling group triggered INSTANCE increase to 2

The details of the two instances now running

The details of the two instances now running

In summary

Now after all is finished, and the auto-scaling is working, you technically have something like shown in the diagram below. To test/verify, I encourage you to use all of the commands that I presented during the tutorial, the euca*, eulb*, euwatch* to verify the functionality. I understand that there are probably many other questions here, specifically about the load-balancer internal functions, but this calls actually for actually start learning Eucalyptus for production deployment and that is right now beyond the target of this quick introduction article. But feel free to check the external links below for more information on eucalyptus (especially the administrator guide).

The final auto-scaling architecture at the end of this tutorial

The final auto-scaling architecture at the end of this tutorial

External resources:

Eucalyptus Documentation – https://www.eucalyptus.com/docs/eucalyptus/4.1.0/index.html

Eucalyptus Administrator Guide – https://www.eucalyptus.com/docs/eucalyptus/4.1.0/admin-guide/index.html

To meet other people and get community support, go for IRC to #freenode.com and go for #eucalyptus channel

Tutorial: Email server for a small company – including IMAP for mobiles, SPF and DKIM

$
0
0

For best article visual quality, open Tutorial: Email server for a small company – including IMAP for mobiles, SPF and DKIM directly at NetworkGeekStuff.

email_iconA few months back my wife started a small business. Of course I was the one to build the “IT stuff” here that included a website, some reservation system on it for customers (php programming here), local network in the office and customer area and other things. Most of that was all pretty common tasks for me with the exception of one, building an email system for a company emails. So I built it and since it was new and interesting experience for me, I will share here a quick tutorial (or better call this a cookbook?) to replicate the very minimum system.

Now also let me state here that I really missed somehow in my life running a real email system so far. And it was a little challenge to setup it properly for the first time. I always thought in the past that installing SMTP daemon in linux and activating it for all local users was all that I will ever need (because up to this point my needs were only to receive monitoring and alarm emails to my gmail, nothing else). Now that my needs has moved to a much more “representative” role the approach had to be changed a lot.

Prerequisites

1) A Linux server, preferably debian to follow this tutorial step by step, on other distributions the software packages and file paths can be different

2) Public IP address preferably directly on the server (+ if you are not directly owning the IP in RIPE database, the provider of this IP address to you should be able and willing to set reverse DNS entry on this IP address later in this tutorial, so if you are just looking for provider check this with him before ordering a service from him).

3) A publicly registered domain name either with some DNS hosting company (like I used here for convenience) or you can do yourself a small DNS server (but this is outside of this tutorial). If you will have a DNS provider, just make sure he allows you to enter TXT records for your domain record.

My example users and domain used in this tutorial

In this tutorial, I will be using one of my public domains “pingonyou.com” that I am personally owning, but which I am not really using at this moment for anything usefull. Please change all pingonyou.com text in this tutorial to your own domain when following this tutorial. At the point of writing this tutorial this pingonyou.com was pointing to public IP of 31.186.250.195, which is one small VM server I was renting at the time, this is also no longer in my possession. 

Also the demouser account I will be using is a fake, so do not bother sending email to demouser@pingonyou.com.

The target what we will have at the end of this tutorial

  • We would like to have an email system with email in the form of @pingonyou.com
  • We would like to have IMAP secured with SSL for access to your emails (test is to access emails from your smartphone)
  • We would like all standard protection mechanisms on our emails so that other email systems do not classify our emails as SPAM, this includes SPF, DKIM, rDNS and SpamAssassin header.

The implementation Step-by-Step

Step 1: Configure local hostname and domain on linux server

In this step, we have to first realize how we will call our systems. As I mentioned earlier, I will use “pingonyou.com” as example of domain and our server you are free to designate as you wish with a hostname, as example here I will use “pingonyouserver“. The last point is that if I will need to use a public IP address for your mail server or DNS, I will use 8.8.8.8 example (this is a gmail DNS system FYI).

# echo pingonyouserver> /etc/hostname
# hostname -F /etc/hostname
# echo “8.8.8.8   pingonyouserver.pingonyou.com pingonyouserver” >> /etc/hosts

Verification is easy, just use these commands and you should get the answers visible.

# hostname --short
pingonyouserver

# hostname --domain
pingonyou.com

# hostname --fqdn
pingonyouserver.pingonyou.com

# hostname --ip-address
8.8.8.8

Step 2: Install email system exim4 and supporting packages

To get all the software in debian for our little tutorial, we need three main pieces of software:

  1. Exim4 – the SMTP daemon
  2. Courier – communication extension for Exim4 to have IMAP and POP access to emails
  3. Swaks – Swiss army knife for SMTP troubleshooting
  4. SSL-cert packages – for easy work with generating certificates in later parts of the tutorial

If you are using debian like I am, then you can simply follow these commands :

# apt-get update 
# apt-get install exim4-daemon-heavy courier-authdaemon courier-imap \
courier-imap-ssl courier-pop courier-pop-ssl swaks libnet-ssleay-perl \
ssl-cert

===============================================
Note/Warning:
The courier will by default use a self-signed certificates, these are OK if you are going to be the only user of the mail system, but if you plan to invite many people like for a public system (and you do not plan to distribute your own certification authority to them), then you need a signed-certificate. But for our use-case we will not go into replacing these for our small IMAP usage which is OK for a small company, but definitely not OK for a public or larger one! This is also the warning installation will give you about this fact:
courier warning===============================================

Verification of the installation can be afterwards done by checking the running ports with a netstat command if all the pop3, imap, smtp, pop3s and imaps ports are present like visible like in the example below:

# netstat –utal
-- omitted --
tcp6       0      0 [::]:pop3               [::]:*                  LISTEN     
tcp6       0      0 [::]:imap2              [::]:*                  LISTEN     
tcp6       0      0 [::]:ssh                [::]:*                  LISTEN     
tcp6       0      0 localhost:smtp          [::]:*                  LISTEN     
tcp6       0      0 [::]:imaps              [::]:*                  LISTEN     
tcp6       0      0 [::]:pop3s              [::]:*                  LISTEN

Step 3: Preparing local users for mail system (Maildir)

In this example, I will prefer each user having his email inside his home directory under ~/Maildir. For the new users, add this directory to the skeleton so that it is automatically created for new users like this:

# maildirmake /etc/skel/Maildir

For existing users, you have to do this manually (or do a script for this). For example for my test user “testuser” like this:

# maildirmake ~demouser/Maildir
# chown –R demouser.demouser ~demouser/Maildir

Step 4: Create new user to test the mail system

# adduser demouser

Give this user a password when prompted. Always choose a good password here because this UNIX passwords will also be user by the IMAP/POP3 access to your emails!

Step 5: Configure exim4

Now, first step here is to use the debian built-in configuration package to configure the “main” exim4 points with:

dpkg-reconfigure exim4-config

It will give you several options in a wizard, this is how I configured my answers for a small and independent server:

  • General type of mail configuration: internet site; mail is sent and received directly using SMTP
  • System mail name: pingonyou.com
  • IP-addresses to listen on for incoming SMTP connections: leave this field empty!!!
  • Other destinations for which mail is accepted: leave this field empty!!!
  • Domains to relay mail for: leave this field empty!!!
  • Machines to relay mail for: leave this field empty!!!
  • Keep number of DNS-queries minimal (Dial-on-Demand)?:NO
  • Delivery method for local mail: Maildir format in home directory
  • Split configuration into small files?: NO
  • Root and postmaster mail recipient: demouser (or your real administrator name, but non-root account)

 Step 6: X.509 certificate for exim4 TLS support

First run this small command to generate a certificate based on example from exim.

# /usr/share/doc/exim4-base/examples/exim-gencert
[*] Creating a self signed SSL certificate for Exim!
    This may be sufficient to establish encrypted connections but for
    secure identification you need to buy a real certificate!
    
    Please enter the hostname of your MTA at the Common Name (CN) prompt!
    
Generating a 1024 bit RSA private key
...........................................++++++
....................................................................++++++
writing new private key to '/etc/exim4/exim.key'
-----
You are about to be asked to enter information that will be incorporated
into your certificate request.
What you are about to enter is what is called a Distinguished Name or a DN.
There are quite a few fields but you can leave some blank
For some fields there will be a default value,
If you enter '.', the field will be left blank.
-----
Country Code (2 letters) [US]:SK
State or Province Name (full name) []:Slovakia
Locality Name (eg, city) []:Bratislava
Organization Name (eg, company; recommended) []:pingonyou.com
Organizational Unit Name (eg, section) []:pingonyou.com
Server name (eg. ssl.domain.tld; required!!!) []:pingonyouserver.pingonyou.com
Email Address []:demouser
[*] Done generating self signed certificates for exim!
    Refer to the documentation and example configuration files
    over at /usr/share/doc/exim4-base/ for an idea on how to enable TLS
    support in your mail transfer agent.

Next, based on the documentation you find in /usr/share/doc/exim4-base/ , you should create a file /etc/exim4/exim4.conf.localmacros to and insert these lines to enable TLS support on port 465.

echo "MAIN_TLS_ENABLE = true" > /etc/exim4/exim4.conf.localmacros
echo "tls_on_connect_ports = 465" >> /etc/exim4/exim4.conf.localmacros

Inside /etc/default/exim4 change this line:

SMTPLISTENEROPTIONS=''

To this:

SMTPLISTENEROPTIONS='-oX 465:25:587 -oP /var/run/exim4/exim.pid'

Ok, now restart exim4 again with the service command

# service exim4 restart

And check if the exim4 is listening on port 465:

# netstat -atupln | grep 465
tcp        0      0 0.0.0.0:465    0.0.0.0:*    LISTEN      16020/exim4     
tcp6       0      0 :::465         :::*         LISTEN      16020/exim4

 Step 7: Verification of emails delivery

Ok, so the basic email system should now be running, lets test it with the most basic test and that is sending an email locally (either between two users of the local system or to yourself).

For my test, I will send email to testuser from testuser.

echo “test message content” | mail –s “test subject” demouser@pingonyou.com

You can either check the inbox of demouser, or more simply check logs inside /var/log/exim4/mainlog

cat /var/log/exim4/mainlog
2014-12-23 16:56:42 1Y3XRa-0004B4-Sj <= root@pingonyou.com U=root P=local S=391
2014-12-23 16:56:42 1Y3XRa-0004B4-Sj => demouser <demouser@pingonyou.com> R=local_user T=maildir_home
2014-12-23 16:56:42 1Y3XRa-0004B4-Sj Completed

Ok, all looks good, now lets try sending to external source like gmail (replace the xxxx with your real email).

echo “test message content” | mail –s “test subject” xxxxx@gmail.com

Now the good and the bad part, the email arrived, but it ended most probably in spam folder because technically this is a “rogue” system with unknown domain and no basic signatures in the email headers.

Step 8-9: First problem with PAM not enabled in courier

As immediate step after my emails got working was that Thunderbird was unable to connect to the courier with IMAPS (with TLS enabled) despite the basic certificates existed from the installation (during apt-get install a default set was generated).

To verify what is going one, this is the best test to see the problem, we will use SWAKS to troubleshoot like this:

# swaks -a -tls -q AUTH -s localhost -au demouser     
Password: playingwithexim4
=== Trying localhost:25...
=== Connected to localhost.
<-  220 pingonyouserver.pingonyou.com ESMTP Exim 4.80 Tue, 23 Dec 2014 20:10:29 -0500
 -> EHLO pingonyouserver.pingonyou.com
<-  250-pingonyouserver.pingonyou.com Hello localhost [127.0.0.1]
<-  250-SIZE 52428800
<-  250-8BITMIME
<-  250-PIPELINING
<-  250-STARTTLS
<-  250 HELP
 -> STARTTLS
<-  220 TLS go ahead
=== TLS started w/ cipher DHE-RSA-AES256-SHA256
=== TLS peer subject DN="/C=SK/ST=Slovakia/L=Bratislava/O=pingonyou.com/OU=pingonyou.com/CN=pingonyouserver.pingonyou.com/emailAddress=demouser"
 ~> EHLO pingonyouserver.pingonyou.com
<~  250-pingonyouserver.pingonyou.com Hello localhost [127.0.0.1]
<~  250-SIZE 52428800
<~  250-8BITMIME
<~  250-PIPELINING
<~  250 HELP
*** Host did not advertise authentication
 ~> QUIT
<~  221 pingonyouserver.pingonyou.com closing connection
=== Connection closed with remote host.

As you noticed, the TLS layer is there successfully, the problem is more with the authentication not working.

  1. Add these lines to /etc/exim4/exim4.conf.template
    MAIN_TLS_ENABLE = yes
    tls_on_connect_ports=465 
    rfc1413_query_timeout = 0s
  2. Install SASLAUTH daemon that will do the authentication for us against local unix usernames.
    NOTE: If you want some other method of authentication, check the exim4 wiki.
    # apt-get install sasl2-bin
  3. Edit /etc/default/saslauthd to enable saslauth with this line change:
    START=yes
  4. Restart the SASLAUTH daemon:
    # /etc/init.d/saslauthd start
  5. Add exim to sasl group
    # adduser Debian-exim sasl
    Adding user `Debian-exim' to group `sasl' ...
    Adding user Debian-exim to group sasl
    Done.
  6.  Inside /etc/exim4/exim4.conf.template uncomment these lines to enable PAM authentication (in the below all lines below and including the “plain_saslauthd_server”):
    # Authenticate against local passwords using sasl2-bin
    # Requires exim_uid to be a member of sasl group, see README.Debian.gz
    # plain_saslauthd_server:
    #   driver = plaintext
    #   public_name = PLAIN
    #   server_condition = ${if saslauthd{{$auth2}{$auth3}}{1}{0}}
    #   server_set_id = $auth2
    #   server_prompts = : 
    #   .ifndef AUTH_SERVER_ALLOW_NOTLS_PASSWORDS 
    #   server_advertise_condition = ${if eq{$tls_cipher}{}{}{*}}
    #   .endif
  7.  Do a restart of both exim4 and saslauth
    # update-exim4.conf
    # service exim4 restart
    # service saslauthd restart

VERIFICATION is again with swaks the same command, but now you should get this (note “235 Authentication succeeded” below):

swaks -a -tls -q AUTH -s localhost -au demouser
Password: kreten
=== Trying localhost:25...
=== Connected to localhost.
<-  220 pingonyouserver.pingonyou.com ESMTP Exim 4.80 Tue, 23 Dec 2014 20:58:57 -0500
 -> EHLO pingonyouserver.pingonyou.com
<-  250-pingonyouserver.pingonyou.com Hello localhost [127.0.0.1]
<-  250-SIZE 52428800
<-  250-8BITMIME
<-  250-PIPELINING
<-  250-STARTTLS
<-  250 HELP
 -> STARTTLS
<-  220 TLS go ahead
=== TLS started w/ cipher DHE-RSA-AES256-SHA256
=== TLS peer subject DN="/C=SK/ST=Slovakia/L=Bratislava/O=pingonyou.com/OU=pingonyou.com/CN=pingonyouserver.pingonyou.com/emailAddress=demouser"
 ~> EHLO pingonyouserver.pingonyou.com
<~  250-pingonyouserver.pingonyou.com Hello localhost [127.0.0.1]
<~  250-SIZE 52428800
<~  250-8BITMIME
<~  250-PIPELINING
<~  250-AUTH PLAIN
<~  250 HELP
 ~> AUTH PLAIN AGRlbW91c2VyAGtyZXRlbg==
<~  235 Authentication succeeded
 ~> QUIT
<~  221 pingonyouserver.pingonyou.com closing connection
=== Connection closed with remote host.

 Step 10: Configure courier for IMAP

You want this because it is most useful for your smartphone access that is definitely supporting mainly IMAP. Just follow these basic commands:

# rm -rf /etc/courier/*.pem
# make-ssl-cert /usr/share/ssl-cert/ssleay.cnf /etc/courier/imapd.pem 
# make-ssl-cert /usr/share/ssl-cert/ssleay.cnf /etc/courier/pop3d.pem

# service courier-imap restart
# service courier-imap-ssl restart
# service courier-authdaemon restart
# service courier-pop restart
# service courier-pop-ssl restart

Step 11: Test access with email client (e.g. Thunderbird)

I am personally using Thunderbird for a long time now, but if you have a different preferred client, please feel free to try using it (including smartphone mail clients that support IMAP protocol). These are my Thunderbird settings that worked for this example configuration.

Thunderbird wizard adding new email account and manually configured IMAP and SMTP parameters

Thunderbird wizard adding new email account and manually configured IMAP and SMTP parameters

NOTE: Since we are using self-signed certificates here, you are definitely going to get warnings from Thunderbird (or other clients) that the certificates are not officially trusted. If you are doing this for a real company, please go and purchase a real certificates from certification authorities (e.g. verisign…)

Thunderbird self-signed certificate warning

Thunderbird self-signed certificate warning

If your connection with any client was successful, please try writing a quick email to yourself, for example this is how it looked in my system in Thunderbird.

Thunderbird email loop test

Thunderbird email loop test

Or here is the raw message code:

Return-path: <demouser@pingonyou.com>
Envelope-to: demouser@pingonyou.com
Delivery-date: Tue, 23 Dec 2014 21:57:21 -0500
Received: from [217.73.23.84] (helo=[192.168.2.115])
	by pingonyouserver.pingonyou.com with esmtpsa (TLS1.2:DHE_RSA_AES_128_CBC_SHA1:128)
	(Exim 4.80)
	(envelope-from <demouser@pingonyou.com>)
	id 1Y3c8X-00055r-CJ
	for demouser@pingonyou.com; Tue, 23 Dec 2014 21:57:21 -0500
Message-ID: <549A1DA1.1030708@pingonyou.com>
Date: Wed, 24 Dec 2014 02:57:53 +0100
From: "Havrila, Peter" <demouser@pingonyou.com>
User-Agent: Mozilla/5.0 (Windows NT 6.1; WOW64; rv:31.0) Gecko/20100101 Thunderbird/31.3.0
MIME-Version: 1.0
To: demouser@pingonyou.com
Subject: loop test email
Content-Type: text/plain; charset=utf-8; format=flowed
Content-Transfer-Encoding: 7bit

Hello World :)

 Step 12: Testing towards gmail or other external system

Now simply use Thunderbird, or other client and send an email to external systems, but the point he is that there is a random chance (for example I expect ~50% chance with gmail) that your email will end in spam folder on the destination.

HINT: To check if your email left your system, check all the mail logs in the /var/log/mail*

Step 13: Making the email system appear as a valid domain owner for passing spam filters

There are three basic things every email system should do to get anti-spam protection permitting emails received from your new systems to remote systems inboxes without ending in spam folders.

  1. rDNS (or reverse DNS)  to have reverse DNS lookup on the public IP pointing back to your domain.
  2. SPF (Sender Policy Framework) that let’s the receiving system know which systems are allowed to send emails for your domain.
  3. DKIM (DocumentKeys Identified Mails) a public/private key pair that is used for signing emails by the domain owner to avoid spammers being able to send emails “as if” coming from your domain.

Step 13A: Reverse DNS entry

Now, this part is between you and your provider, but you must ask the owner of the public IP you are using to create a reverse DNS entry for you.

Most providers of servers (ramnode, nfoserver, etc… ) have this option as part of their control panel so the work is a few clicks, but it is imperative to do.

DISCLAIMER: I am going to use in the following example the public IP of 31.186.250.195 which I was on temporary measure using in one rented virtual server from undisclosed provider. I do not own this IP, please consider this IP only as random public IP without any technical meaning and replace in this step with your own public IP used.

A quick view on one such system:

eDNS setting example with my server provider GUI

eDNS setting example with my server provider GUI

To verify, either use “nslookup -r” command to your own domain, or web tool such as this one http://mxtoolbox.com/SuperTool.aspx

demouser@pingonyouserver:~$ nslookup -r 31.186.250.195
*** Invalid option: r
Server:         8.8.8.8
Address:        8.8.8.8#53

Non-authoritative answer:
195.250.186.31.in-addr.arpa     name = pingonyou.com.

Step 13B: SPF

In summary to what we will be doing here for SPF is basically again that you need to interact either with your own DNS system, or contact your DNS hosting company (or do this via their control panel if they have this) and ask them to enter some special TXT records to your domain. Here are example steps to follow:

  1. First I absolutely stress that you read this page to understand SFP to avoid generating something incorrectly and hurting you email system from the very beginning!
    http://www.openspf.org/SPF_Record_Syntax
  2. For my example, I simply want to allow my main server “yourmailserver” from my “yourcompany.com” domain to send emails. So the records for my are like this for SPF1 and SPF2 records:
    v=spf1 a include:pingonyouserver.pingonyou.com –all
    spf2.0/pra a include:pingonyouserver.pingonyou.com -all

    Quick legend:
    1. the “a” allows any of the DNS A records to authorize domains (like basic pingonyou.com) to send emails.
    2. the “include” allows other domains like the server FQDN to send the email (MAKE SURE YOU ALSO HAVE A DNS A RECORD FOR YOUR SERVER FQDN!)
    3. “-all” removes all other IPs/Domains from the ability of sending emails.EXAMPLE: My provider (websupport.sk) has a nice GUI to edit these TXT records for my domains, please adjust this step according to your way of DNS providing, I am 99% sure your DNS provider will support this, or if you are self-DNS hosting, adding this to your database shouldn’t be a problem for you. Please note that “yourcompany.com” is a fake, so I will show here as example a picture how I have setup one of my domains pingonyou.com, which is currently not really hosting anything useful.

      TXT record editing example in web gui of my provider (websupport.sk) for my inactive pingonyou.com domain

      TXT record editing example in web gui of my provider (websupport.sk) for my pingonyou.com domain

  3. You can then apply them to the DNS record and test it with an online tool like this:
    http://tools.bevhost.com/spf/HINT: At the very end of this guide, we will be sending a test email to a testing service that will verify SPF and other useful things for us, so if you have trouble with this tool, wait with testing for that.

 Step 13c: DKIM public keypair to sign emails leaving your system

Now this one is a little more tricky as we are again going to play with certificates, but also with exim4 routing of emails. So let’s take it slowly:

  1. Generate an RSA public and private keys with openssl
    # sudo openssl genrsa -out /etc/exim4/private.key 1024
    # sudo openssl rsa -in /etc/exim4/private.key -out /etc/exim4/public.pem -pubout -outform PEM
    # sudo chown Debian-exim:root /etc/exim4/private.key /etc/exim4/public.pem
  2. Read your new public key
    # cat /etc/exim4/public.pem 
    -----BEGIN PUBLIC KEY-----
    MIGfMA0GCSqGSIb3DQEBAQUAA4GNADCBiQKBgQDA+WiFmhUpuOav+3oB77E0j06p
    DAr5cw9NKkcf9tcDbn7nIpBqAIFP8PVTn4tzO3I6LL+o5A9dCGQFPZlzqW8cXPDc
    Zd/4+4NEw1OIbbaUJh/giTyI24qbxBFTaW1nvdxE9qlWbNOYlbOVp4BpXdwmawVw
    V72GKjSR2+ql8wM4cQIDAQAB
    -----END PUBLIC KEY-----
  3. Construct a DNS TXT record with the public key following this formula :
    Domain name: key1._domainkey.<your domain name>
    TXT record: v=DKIM1; k=rsa; p=<your public key string>For my domain example pingonyou.com , this is the TXT record I asked my DNS provider to enter into the DNS system.Domain name:
    key1._domainkey.pingonyou.com.pingonyou.com

    TXT record itself:
    v=DKIM1;\040k=rsa;\040p=MIGfMA0GCSqGSIb3DQEBAQUAA4GNADCBiQKBgQDA+WiFmhUpuOav+3oB77E0j06pDAr5cw9NKkcf9tcDbn7nIpBqAIFP8PVTn4tzO3I6LL+o5A9dCGQFPZlzqW8cXPDcZd/4+4NEw1OIbbaUJh/giTyI24qbxBFTaW1nvdxE9qlWbNOYlbOVp4BpXdwmawVwV72GKjSR2+ql8wM4cQIDAQAB

    Here is how it looked in my DNS provider system:

    DNS TXT record with DKIM key in my example DNS provider (websupport.sk)

    DNS TXT record with DKIM key in my example DNS provider (websupport.sk)

  4. Create a file dkim_senders to tell exim what source domains the DKIM should be used for:
    # echo "*@pingonyou.com: pingonyou.com"  > /etc/exim4/dkim_senders
  5. Edit /etc/exim4.conf.template and in section “router/200_exim4-config_primaryjust beforednslookup_relay_to_domains:” add these new lines:
    #NetworkGeekStuff dkim addon rules:
    dnslookup_dkim:
      debug_print = "R: dnslookup_dkim for $local_part@$domain"
      driver = dnslookup
      domains = ! +local_domains
      senders = lsearch*@;/etc/exim4/dkim_senders
      transport = remote_smtp_dkim
      same_domain_copy_routing = yes
      # ignore private rfc1918 and APIPA addresses
      ignore_target_hosts = 0.0.0.0 : 127.0.0.0/8 : 192.168.0.0/16 :\
                            172.16.0.0/12 : 10.0.0.0/8 : 169.254.0.0/16 :\
                            255.255.255.255
      no_more
  6. Again inside the /etc/exim4/exim4.conf.template inside section “transport/30_exim4-config_remote_smt” just before “remote_smtp:” add these new lines:
    remote_smtp_dkim:
      debug_print = "T: remote_smtp_dkim for $local_part@$domain"
      driver = smtp
      dkim_domain = ${lookup{$sender_address}lsearch*@{/etc/exim4/dkim_senders}}
      dkim_selector = key1
      dkim_private_key = /etc/exim4/rsa.private
      dkim_canon = relaxed
      dkim_strict = false
      #dkim_sign_headers = DKIM_SIGN_HEADERS
  7. Restart exim
    update-exim4.conf
    service exim4 restart
  8. Now you should have everything very nicely prepared, to get a report about how successfully you were, send a test email here (any content) :
    check-auth@verifier.port25.com
    You will get back an email with a very nice and complete summary of the SPF/DKIM and some other checks, here is my example with details how the system from this tutorial passed SFP and DKIM test. I think this is a very nice result so far :)
    ==========================================================
    Summary of Results
    ==========================================================
    SPF check:          pass
    DomainKeys check:   neutral
    DKIM check:         pass
    Sender-ID check:    pass
    SpamAssassin check: ham
    
    ==========================================================
    Details:
    ==========================================================
    
    HELO hostname:  pingonyouserver.pingonyou.com
    Source IP:      31.186.250.195
    mail-from:      demouser@pingonyou.com
    
    ----------------------------------------------------------
    SPF check details:
    ----------------------------------------------------------
    Result:         pass 
    ID(s) verified: smtp.mailfrom=demouser@pingonyou.com
    DNS record(s):
        pingonyou.com. SPF (no records)
        pingonyou.com. 600 IN TXT "v=spf1 a include:pingonyouserver.pingonyou.com -all"
        pingonyou.com. 600 IN TXT "spf2.0/pra a include:pingonyouserver.pingonyou.com -all"
        pingonyou.com. 600 IN A 31.186.250.195
    
    ----------------------------------------------------------
    DKIM check details:
    ----------------------------------------------------------
    Result:         pass (matches From: demouser@pingonyou.com)
    ID(s) verified: header.d=pingonyou.com
    Canonicalized Headers:
        content-transfer-encoding:7bit'0D''0A'
        content-type:text/plain;'20'charset=utf-8;'20'format=flowed'0D''0A'
        in-reply-to:<549B2103.5080605@pingonyou.com>'0D''0A'
        references:<549B2103.5080605@pingonyou.com>'0D''0A'
        subject:test'20'email'20'for'20'DKIM'20'and'20'SPF'0D''0A'
        to:check-auth@verifier.port25.com'0D''0A'
        mime-version:1.0'0D''0A'
        from:"Havrila,'20'Peter"'20'<demouser@pingonyou.com>'0D''0A'
        date:Wed,'20'24'20'Dec'20'2014'20'23:37:38'20'+0100'0D''0A'
        message-id:<549B4032.4040201@pingonyou.com>'0D''0A'
        dkim-signature:v=1;'20'a=rsa-sha256;'20'q=dns/txt;'20'c=relaxed/relaxed;'20'd=pingonyou.com;'20's=key1;'20'h=Content-Transfer-Encoding:Content-Type:In-Reply-To:References:Subject:To:MIME-Version:From:Date:Message-ID;'20'bh=Q22dyZju6AlMzw21jDtbRX5w6L8oTce4upEb75AdLqs=;'20'b=;
    
    Canonicalized Body:
        Test'20'email'20'body'0D''0A'
        
    
    DNS record(s):
        key1._domainkey.pingonyou.com. 600 IN TXT "v=DKIM1; k=rsa; p=MIGfMA0GCSqGSIb3DQEBAQUAA4GNADCBiQKBgQDA+WiFmhUpuOav+3oB77E0j06pDAr5cw9NKkcf9tcDbn7nIpBqAIFP8PVTn4tzO3I6LL+o5A9dCGQFPZlzqW8cXPDcZd/4+4NEw1OIbbaUJh/giTyI24qbxBFTaW1nvdxE9qlWbNOYlbOVp4BpXdwmawVwV72GKjSR2+ql8wM4cQIDAQAB"
    
    Public key used for verification: key1._domainkey.pingonyou.com (1024 bits)
    
    NOTE: DKIM checking has been performed based on the latest DKIM specs
    (RFC 4871 or draft-ietf-dkim-base-10) and verification may fail for
    older versions.  If you are using Port25's PowerMTA, you need to use
    version 3.2r11 or later to get a compatible version of DKIM.

Step 14: SpamAssassin header attachment

One thing that was missing in the previous step last test was the SpamAssassin check. SpamAssassin is mainly used for incomming emails, but I am leaving that for some follow-up tutorial. Right now we are going to use SpamAssassin to add its header to all emails that our system sends to try to declare we are not spam.

So this is a super quick how-to to enable very basic spam-assassin checks on your emails.

DISCLAIMER: Taken mostly from debian exim documentation: https://wiki.debian.org/Exim, not much credit for me here :apt-get install spamassassin

  1. apt-get install spamassassin
  2. Set “ENABLED=1” inside /etc/default/spamassassin
  3. Start the spamassassin daemon:
    # /etc/init.d/spamassassin start
  4. Uncomment this line in /etc/exim4/exim4.conf.template
    spamd_address = 127.0.0.1 783
  5. Edit /etc/exim4/exim4.conf.template and inside section “40_exim4-config_check_data change” edit the content inside  “acl_check_data:” function
    # put headers in all messages (no matter if spam or not)
     warn  spam = nobody:true
         add_header = X-Spam-Score: $spam_score ($spam_bar)
         add_header = X-Spam-Report: $spam_report
    
    # add second subject line with *SPAM* marker when message
    # is over threshold
      warn  spam = nobody
          add_header = Subject: ***SPAM (score:$spam_score)*** $h_Subject:
  6. Rebuild exim config and restart exim
    # update-exim4.conf
    # service exim4 restart
  7. Test by either sending again to check-auth@verifier.port25.com  or catch the outcomming emails from your system and it should have this header inside:
    X-Spam-Score: -1.0 (-)
    X-Spam-Report: Spam detection software, running on the system "pingonyouserver.pingonyou.com", has
     identified this incoming email as possible spam.  The original message
     has been attached to this so you can view it (if it isn't spam) or label
     similar future email.  If you have any questions, see
     @@CONTACT_ADDRESS@@ for details.
     
     Content preview:  Test email body 3 [...] 
     
     Content analysis details:   (-1.0 points, 5.0 required)
     
      pts rule name              description
     ---- ---------------------- --------------------------------------------------
     -1.0 ALL_TRUSTED            Passed through trusted hosts only via SMTP

Summary

In summary, this is how my very first email system started running (only that the used example pingonyou.com is not the real company email, but my test domain that no longer servers emails, so do not bother sending something to it). And yes, the next step to do after the other systems (like gmail) stopped considering us a spam with SPF/DKIM and other functions satisfied is to filter out all the incomming spam! (oh boy how much we started getting it after 6 months …  but solving that is for the next tutorial to come.

I hope you enjoyed this tutorial and it helped you a little. It is not as cool as the cloud/SDN/network topics, but hopefully some basic and practical one is also helpful.

Tutorial for creating first external SDN application for HP SDN VAN controller – Part 1/3: LAB creation and REST API introduction

$
0
0

For best article visual quality, open Tutorial for creating first external SDN application for HP SDN VAN controller – Part 1/3: LAB creation and REST API introduction directly at NetworkGeekStuff.

In this tutorial series, I will show you by example, how to build your first external REST API based SDN application for HP SDN VAN controller, with web interface for the user control. Target will be to learn how to use REST API, curl and perl scripting to generate some basic and useful code to view and also manipulate network traffic.

This article is part of “Tutorial for creating first external SDN application for HP SDN VAN controller” series consisting these articles:

In this Part 1/3, we will discuss creation of a quick development lab with HP SDN VAN controller and Mininet network and explore the REST API interface quickly.

Internal vs External SDN applications

The difference is this, external applications do not need to run inside the SDN controller itself and can rely on REST API commands transferred over network from your “stand-alone” application towards any controller. This makes them more easy to create (because REST API is easy to understand and code against) but you have to have more emphasis on what is your target and how to achieve it because this interface can only act in a “pro-active” way it is relatively slow. For example if you want to do a SDN firewall as external application, you have to push all your rules via REST API to the controller (and in a result all the way down to SDN switches) before the switch has to make a decision on a new packet. REST API will not make a callback event from controller to your external application to ask what to do with a new packet/session in a “re-active” way because it would take too long (imagine 50-100 ms processing delay on every FW decision if this was done via REST API). The problem is also that because we are still talking about switches executing all the rules, it is probably not a good idea to push all these rules via REST API pro-actively as it would generate a lot of intentionally not-needed rules inside each switch.

The SDN firewall application example is actually a good example where if you need something like this, you should make this project an internal application where your application can be notified for each new session even, and make firewall-like decisions only when needed and avoid spamming the SDN switches with all the rules in the firewall logic. However internal application development is not in scope of this article, so if this is your target, go to HP SDN Dev Center and grab an SDK that will help you build such an app in Java an load it to the controller. Or maybe soon such article I will also create here as this is also in my TODO list (actually with the firewall example app :)).

My current take on SDN:

(disclaimer on author’s personal opinion on SDN vs. traditional networking, feel free to skip if you are here only for technical parts)
Is this a prediction or trolling?

Is this a prediction or trolling?

Software Defined Networking (SDN) is becoming a hot topic. Some people consider it a hype, some consider it a much needed revolution to a completely sterile networking industry that has not changed in principle for more than 20 years. I am personally considering SDN also a much needed fresh air and I am hoping in its success because, if you think about it, we are still configuring network devices box-by-box using proprietary command lines of each vendor and you have to technically study each vendor command line specifics to do the same thing you in principle know very well, but need to study how to execute it on this particular vendor devices. You probably know or understand the overhead if you need to switch vendors for some reason and in my opinion why so many customers are simply strictly following using Cisco devices despite they are competitors with at least 30% cheaper alternatives on feature/performance scale with the same quality …. it is simply because cisco has an army of zombies that only know the cisco command line. And network industry has CCIE certification as the most prestigious tech certification in the world, why do you think this is ? And think about the fact that programmers/applications architects/hardware ASIC creators are having a much more creative and complex jobs than network configuration guys! The reason is that to become good at networking (and get nice paycheck), you have to absorb huge amount of low-level (proprietary!) commands and all we are doing is distributed architecture and distributed algorithms, but executed in the worst possible way individually on each device. Today you need in a company like HP 1 engineer to handle roughly 1000 to 10 000 servers, but you need 1 engineer to handle 100 network devices just because we are still manually configuring things like routing/vlan-to-port/etc ….. this is from a principal point of view absolutely needless overhead and SDN is promising us the same revolution here that universal operating systems did to PC industry (you remember computers in the 80s where you bought a computer with relatively fixed feature-set?) or the transition from mobile phones (also here the era was that each mobile had it’s fixed set of functions) to smartphones with universal operating systems and apps.

0_traditional_vs_SDN_Switch

If SDN achieves this, only time will tell because we are all still humans and subject to the “Worse is Better” factor as we witnessed with TCP vs. OSI or 802.11 wifi vs. other more powerful wifi standards that loose only because they were more expensive.

Also SDN is a huge fear factor to major vendors (yes, mostly to Cisco… ) as this would mean they loose the ability to charge for features bundled with each router/switch they sell and competitiveness moves to software apps, where many small companies would become rivals doing advanced features and using HW only as featureless forwarding plane.

My personal opinion after being exposed to some current SDN products is that there is already huge potential in security, QoS and traffic engineering solutions, but also there is a long road ahead until SDN becomes universally more useful in all situations that we have in current networks (especially end-to-end routing/switching and HW support).

And at the end, one of my favorite white papers from Google about their SDN deployment experiences:
https://www.opennetworking.org/images/stories/downloads/sdn-resources/customer-case-studies/cs-googlesdn.pdf

Pre-requisite and LAB/development setup:

The only I used in this example is running two virtual machines.

First VM is running the HP SDN VAN controller 2.4.6 that you can download from here, regarding installation/license I have old article guiding how to install 2.0 version here, luckily the install process is in principle the same, or it become even easier, so here is a quick coockbook for 2.4 version on Ubuntu 14.04 that I put together to make it more easy for you. But note that getting a demo/development license can vary for you, so consult with SDN Dev Center to get one (it was more easy for me as HP person internally in the cookbook).

Second VM you can run any linux and install mininet and apache2 with perl module to simulate virtual network for the controller and have perl/apache for your development. Or to make it more easy for your, either download already created mininet VM from mininet.org or I am actually using SDNhub.org VM here (only note that the SDNhub VM is using Open vSwitch 2.3.9 for OpenFLow 1.4 experimental support and this version of switch even if forced to run OpenFLow 1.3 is having problem with HP controller, so please downgrade the Open vSwitch by installing only the latest stable 2.3.1 version from openvswitch.org).

The small virtual LAB needed in this tutorial that you can run on your host PC if you have at least 8GB RAM on host

The small virtual LAB needed in this tutorial that you can run on your host PC if you have at least 8GB RAM on host

Step 0) Building a mininet virtual LAB network

This is a straight-forward task and you can even build your own topology if you want (mininet.org quick walk through here), but this is the topology I will use and maybe you should follow for the first time so that all the examples of curl/REST API in the next steps match on the IP/flow level.

Mininet target Topology for our LAB

Mininet target Topology for our LAB

Here is the mininet launch script that I am using to launch my lab (just create a file in your mininet VM “double_star.py” and make it executable), I think just by looking at it it is quite clear what these lines achieve and also how you should edit it if you want new switch or a host:

#!/usr/bin/python

from mininet.topo import Topo
from mininet.net import Mininet
from mininet.node import Node , Controller, RemoteController, OVSSwitch
from mininet.log import setLogLevel, info
from mininet.cli import CLI
from mininet.util import irange
from mininet.link import TCLink

c0=RemoteController( 'c0', ip='192.168.125.9' )

class NetworkTopo( Topo ):
    "A simple topology of a double-star access/dist/core."

    def build( self ):

        h1 = self.addHost( 'h1', ip='10.10.2.1/24', defaultRoute='via 10.10.2.254' )
        h2 = self.addHost( 'h2', ip='10.10.2.2/24', defaultRoute='via 10.10.2.254' )
        h3 = self.addHost( 'h3', ip='10.10.2.3/24', defaultRoute='via 10.10.2.254' )
        h4 = self.addHost( 'h4', ip='10.10.2.4/24', defaultRoute='via 10.10.2.254' )
        h5 = self.addHost( 'h5', ip='10.10.2.5/24', defaultRoute='via 10.10.2.254' )
        h6 = self.addHost( 'h6', ip='10.10.2.6/24', defaultRoute='via 10.10.2.254' )
        g1 = self.addHost( 'g1', ip='10.10.2.254/24')
        
        s1 = self.addSwitch( 's1', dpid='0000000000000001',protocols='OpenFlow13' )
        s2 = self.addSwitch( 's2', dpid='0000000000000002',protocols='OpenFlow13' )
        s3 = self.addSwitch( 's3', dpid='0000000000000003',protocols='OpenFlow13' )
        s4 = self.addSwitch( 's4', dpid='0000000000000004',protocols='OpenFlow10' )
        s5 = self.addSwitch( 's5', dpid='0000000000000005',protocols='OpenFlow13' )
        s6 = self.addSwitch( 's6', dpid='0000000000000006',protocols='OpenFlow13' ) 

        #core
        self.addLink ( s1, s2 )

        #distribution
        self.addLink ( s1, s3 )
        self.addLink ( s1, s4 )
        self.addLink ( s1, s5 )
        self.addLink ( s1, s6 )

        self.addLink ( s2, s3 )
        self.addLink ( s2, s4 )
        self.addLink ( s2, s5 )
        self.addLink ( s2, s6 )

        #acccess
        self.addLink( s3, h1 )
        self.addLink( s3, h2 )
        self.addLink( s4, h3 ) 
        self.addLink( s4, h4 ) 
        self.addLink( s5, h5 ) 
        self.addLink( s5, h6 ) 
        self.addLink( s6, g1) 

def run():
    topo = NetworkTopo()
    net = Mininet( topo=topo, controller=c0 )
    net.start()

    CLI( net )
    net.stop()

if __name__ == '__main__':
    setLogLevel( 'info' )
    run()

NOTE: If you are playing with mininet and experiment with different topologies, after each attempt always clean the mininet by issuing the mn -c command.

Step 1) Checking your HP SDN VAN controller running your LAB

In this step, we will check that you can access the controller and we see the mininet topology  and more importantly we will disable the controller running in hybrid mode as that will create a loop/broadcast storm in our mininet by default if we do not disable this (explanation below).

Login to your SDN controller in your lab is simply going to https://192.168.125.9:8443/sdn/ui/ (accept the self-signed certificate warning)

Inside, check if all six switches are in the in the OpenFlow Monitor and the topology is visible inside the OpenFlow Topology:

HP VAN SDN Controller 2.4.6 OpenFlow Monitor view

HP VAN SDN Controller 2.4.6 OpenFlow Monitor view

HP VAN SDN Controller 2.4.6 OpenFlow Topology view

HP VAN SDN Controller 2.4.6 OpenFlow Topology view

TIP: To stop the topology “elastic” behavior press “X” on your keyboard. And to show port numbers press “P” on your keyboard. This view is using keyboard shortcuts for control. Full list you can view if you click on the “?” button in above to topology map.

Next lets disable the hybrid mode on the controller.

Explanation: Hybrid mode is a mode where the controller will leave the forwarding logic on the switches and will only care on extra features (like QoS or security). It is a great trick if you want to remain using your traditional fowrarding (including spanning-tree) and only focus on new SDN features, but it has a drawback. In this mode the controller will push a simple “Forward ANY: NORMAL” command to all switches which will tell them that by default all traffic should be simply forwarded by traditional means … this is conflict with the fact that tha Open vSwitch we are running doesn’t have spanning-tree protocol and our topology has many loops. … so yes, it is a broadcast storm prone … The fact is that HP is selling this technology and by default expecting HP switches that can also run in hybrid mode, which means that you would have SDN for all special features, but will still run spanning tree to avoid loops. It is actually very effective with MSTP and IRF technology that HP has that will not really block any port and will lower the processing of the SDN controller in production network, but it is not a pure SDN forwarding that we want to play with in our LAB now. So we will disable hybrid mode and force the SDN controller to take full responsibility on ALL forwarding decisions. You can check any switch Flow table before and after this change to see that the default rule pushed to the switches will change from default “forward: NORMAL” to “forward: Controller”. The forward: Controller means that if there is new packet that is not matching any existing rule, send this packet to controller for analysis.

To disable this mode, go to Configurations -> ControllerManager and modify the hybrid.mode flag to false via the Modify button at the top. All switches will disconnect and reconnect once you apply this.

HP VAN SDN Controller 2.4.6 - disabling hybrid mode

HP VAN SDN Controller 2.4.6 – disabling hybrid mode


Following getting rid of the hybrid mode, let’s check the forwarding, mininet has one great command called “pingall” that will check connectivity between all the hosts created in the mininet topology, run it in the mininet> commandline, sucessfull output looks like this:

mininet> pingall
*** Ping: testing ping reachability
g1 -> h1 h2 h3 h4 h5 h6 
h1 -> g1 h2 h3 h4 h5 h6 
h2 -> g1 h1 h3 h4 h5 h6 
h3 -> g1 h1 h2 h4 h5 h6 
h4 -> g1 h1 h2 h3 h5 h6 
h5 -> g1 h1 h2 h3 h4 h6 
h6 -> g1 h1 h2 h3 h4 h5 
*** Results: 0% dropped (42/42 received)

Now look at the topology view again and all the hosts that appeared:

HP VAN SDN Controller 2.4.6 - all lab nodes appeared

HP VAN SDN Controller 2.4.6 – all lab nodes appeared

And also if you now go to OpenFlow monitor, select a switch and view its flow tables, there is going to be a lot of rules there now all doing point-to-point IP rules to guide the ICMP packets to their destinations.

HP VAN SDN Controller 2.4.6 - flow tables for ping without hybrid mode

HP VAN SDN Controller 2.4.6 – flow tables for ping without hybrid mode

Last thing to learn before we continue is to know the OpenFlow topology view ability to show you a patch for a specific packet. Wait for a few seconds for the ICMP flows to timeout from the tables before continuing. Open this view and at the top change “SPF” to “Follow Flow”, now we are going to see how at this moment the switches would forward a traffic from H1 (10.10.2.1) to G1 (10.10.2.254). Enter into the table “Abstract Packet” the source and destination IPs of these hosts, or click on them and select them as SRC/DST with the buttons above. This is what will happen, note that the red lines are not showing any path at this moment!  This is because this function is not asking the controller, but it is asking the switches and checking their flow tables, but because the icmp flows already timeout.

HP VAN SDN Controller 2.4.6 - no path yet in OpenFLow

HP VAN SDN Controller 2.4.6 – no path yet in OpenFLow

Lets do something more interesting now compared to ping. Mininet has a small HTTP server available, so we will make G1 a server and H1 will to to G1 with HTTP request. These are the two commands to do this simply and verify the controller can also forward TCP traffic and not only pings.

mininet> g1 python -m SimpleHTTPServer 80 &
mininet> h1 wget 10.10.2.254
--2015-05-19 06:18:11--  http://10.10.2.254/
Connecting to 10.10.2.254:80... connected.
HTTP request sent, awaiting response... 200 OK
Length: 942 [text/html]
Saving to: index.html

100%[======================================>] 942         --.-K/s   in 0.03s   

2015-05-19 06:18:11 (36.0 KB/s) - index.html saved [942/942]

Now have a look again in the topology view:

HP VAN SDN Controller 2.4.6 - path between G1 and H1

HP VAN SDN Controller 2.4.6 – path between G1 and H1

Remember this approach because we are going to use this soon below to see how we will manipulate this path with a few curl calls.

Step 2) Intruduction to the REST API

Ok, we have a working topology, working controller, now lets see what is the REST API I mentioned….

Open your browser and go to your controller REST API interface, you should see something like this and feel free to click around:

HP VAN SDN Controller 2.4.6 - REST API main page

HP VAN SDN Controller 2.4.6 – REST API main page

What you see is the REST API way to self-document itself a little. These sections are both trying to explain you what they can do for you and also give you a way to try them directly in this web interface without writing any app (this also help the development process very much!).

But first we need to authenticate ourselves to this interface! This is how to do it:

  1. Open the /auth section
  2. Opent the POST method /auth, these methods are HTTP “POST” methods for entering data via REST API
  3. And write this text to the field (update the “sdn” username and “skyline” password if you are not using the defaults) and hit “Try it out!” button:
    {"login":{"user":"sdn","password":"skyline","domain":"sdn"}}

NOTE: The format we have entered is called JSON and it is a structured key/value list that I believe will become very familiar to you very soon once you see it in a structured way.

This should be the result, note the Response Code should be 200 and in the Response Body we are looking for the “token” value:

HP VAN SDN Controller 2.4.6 - REST API authentication success and receiving the auth token

HP VAN SDN Controller 2.4.6 – REST API authentication success and receiving the auth token

Now, take the token and enter it to the top formular on this REST API page and hit “Explore” to have your full session authorized for all the other REST APIs we are going to check next:

HP VAN SDN Controller 2.4.6 - REST API authentication token included in the whole API

HP VAN SDN Controller 2.4.6 – REST API authentication token included in the whole API

Step 3)
Getting list of switches, list of end-nodes and flow tables via REST API

With this token now included, I encourage you to explore yourself at least these three sections:

/nodes

/nodes – gives you a JSON list of all the end hosts that were recently active in the network. So in this example only the H1 and G1 hosts are shown:

HP VAN SDN Controller 2.4.6 - REST API list of /nodes

HP VAN SDN Controller 2.4.6 – REST API list of /nodes

/devices

/devices – gives you a list of all switches that are currently active (those with “Online”) but also switches that were historically used and are no longer registered (controller remembers them as Offline even across reboots). The most important attribute there is the uid identification that we will be using in the flow table next.

HP VAN SDN Controller 2.4.6 - REST API list of /devices or switches

HP VAN SDN Controller 2.4.6 – REST API list of /devices or switches

/of/datapath/{dpid}/flows

/of/datapath – holds the flow forwarding information, the basic flow table can be retrieved here by asking for a flow table of individual switch via the {dpid} (or uid from the previous /devices). Here is an example how we exported flow table from the switch s3, that has dpid of “00:00:00:00:00:00:00:03″.

HP VAN SDN Controller 2.4.6 - REST API list of flows defined for switch S3 by dpid of 00:00:00:00:00:00:00:03

HP VAN SDN Controller 2.4.6 – REST API list of flows defined for switch S3 by dpid of 00:00:00:00:00:00:00:03

END of Part 1/3 – LAB creation and REST API introduction

In this part, we have a running HP SDN controller, Mininet lab and basic access to REST API and troubleshooting forwarding via the controller gui. In the next part. We will be moving to some basic commands to retrieve the JSON data via REST API directly from linux scripts using the curl commands.

Index:

Tutorial for creating first external SDN application for HP SDN VAN controller – Part 2/3: Influencing Flows via cURL commands

$
0
0

For best article visual quality, open Tutorial for creating first external SDN application for HP SDN VAN controller – Part 2/3: Influencing Flows via cURL commands directly at NetworkGeekStuff.

In this tutorial series, I will show you by example, how to build your first external REST API based SDN application for HP SDN VAN controller, with web interface for the user control. Target will be to learn how to use REST API, curl and perl scripting to generate some basic and useful code to view and also manipulate network traffic.

This article is part of “Tutorial for creating first external SDN application for HP SDN VAN controller” series consisting these articles:

In this Part 2/3, we will discuss how to create a few cURL commands in linux environment, authenticate to the controller REST API interface and generate flows to modify the forwarding path overriding the controller decisions.

Step 1) cURL command line tool to authenticate to the REST API and receive a token

Lets start with the basics, in linux console exists a utility command “curl” that we will use. The command to send basic JSON structure with username/password to the controller /auth in REST API is as follows:

$ curl -k -H 'Content-Type:application/json' \
       -d'{"login":{"user":"sdn","password":"skyline","domain":"sdn"}}' \
       https://192.168.125.9:8443/sdn/v2.0/auth

Explanation:
-k:  Allow connections to SSL sites without certs (H) , we need this because of the self-signed certificate used by default
-H: This parameter enables adding information to the HTTP header, we need to insert here that the content of this HTTP header is going to be a JSON data structure
-d: This parameter is giving cURL the content to add to the content of this HTTP request.
[url]: Every curl rrequest needs a URL where to send it, in our case notice that the URL is the SDN REST API URL that you know from the previous part of this tutorial

NOTE: If you are missing this on your ubuntu VM that we discussed in previous part, install this command with:

$ sudo apt-get install curl

How should the output look-like? This is what you should probably get when you execute this command on the LAB environment:

# curl -sk -H 'Content-Type:application/json' \
       -d'{"login":{"user":"sdn","password":"skyline","domain":"sdn"}}' \
       https://192.168.125.9:8443/sdn/v2.0/auth

Outcome:

{"record":{"token":"ca6f17e6e47946eb9fccba74493de371","expiration":1432050428000,"expirationDate":"2015-05-19 17-47-08 +0200","userId":"8cc58ebf5b0a42b78384a66f577de3a2","userName":"sdn","domainId":"4ffb24500bcc4122905435c4e6882d6d","domainName":"sdn","roles":["sdn-user","sdn-admin"]}}

Uff, … what a mess. This is not really readable, so lets try to format it a little better. We can using the python json library command python -mjson.tool that takes the STDIN and formats it in a human readable way. So again, just note that I have added a pipeline at the end with the python at the end.

# curl -sk -H 'Content-Type:application/json' \
       -d'{"login":{"user":"sdn","password":"skyline","domain":"sdn"}}' \
       https://192.168.125.9:8443/sdn/v2.0/auth \
| python -mjson.tool

Outcome:

{
    "record": {
        "domainId": "4ffb24500bcc4122905435c4e6882d6d",
        "domainName": "sdn",
        "expiration": 1432050873000,
        "expirationDate": "2015-05-19 17-54-33 +0200",
        "roles": [
            "sdn-user",
            "sdn-admin"
        ],
        "token": "53c50d119559431e9dd555d1c7cb916c",
        "userId": "8cc58ebf5b0a42b78384a66f577de3a2",
        "userName": "sdn"
    }
}

Much better! Now you can see that we have again received a “token” that is a value we are going to need with all the following cURL requests to other parts of the REST API. So, lets make this a little bit more easy, lets have this command to only extract the token value and add it to a global variable in bash (which should be your default ubuntu command line, if not, enter bash command to activate it).

First let’s filter the token value from all the other stuff. I will do it the old fashion way with grep/tr/cut commands. The command is now this:

curl -sk -H 'Content-Type:application/json' \
       -d'{"login":{"user":"sdn","password":"skyline","domain":"sdn"}}' \
       https://192.168.125.9:8443/sdn/v2.0/auth \
| python -mjson.tool \
| grep "token" \
| tr -d [:space:] \
| tr -d "\"," \
| cut -d ":" -f 2

Explanation:
grep – command to filter only lines of STDIN where a given string is present
tr – truncate command that replaces all appearances of one letter from source string with another letter, in this case we used it twice, once to remove white spaces and second time to clear quotation marks and comma sign.
cut – this tool is used to cut a certain words from a single line STDIN (imagine grep, but vertical) with the deminator of “:” and we want the second column.

NOTE: JSON can be quite nicelly parsed in different languages and there is also a nice “jq” tool that I personally like to use, but I wanted this tutorial to avoid dependencies as much as possible so JSON parsing will be done in this old-fasion way here (at least until we get to perl). If you want to try something much more simple, check jq tool that can be used to get you any JSON variable directly.

Outcome:

2c8bbb5ac2db4162a2f95a064706dcc4

Cool, I now only have a quick script to get the value. So lets just export it to a file in /tmp directory in bash shell so that all our next scripts can use this without asking the controller for it again, but for this, lets start making this as a bash script so open your favorite editor and write this into the file:

#add our token to the variable "token"
token=`curl -sk -H 'Content-Type:application/json' \
     -d'{"login":{"user":"sdn","password":"skyline","domain":"sdn"}}' \
     https://192.168.125.9:8443/sdn/v2.0/auth \
              | python -mjson.tool \
              | grep "token" \   
              | tr -d [:space:] \
              | tr -d "\"," \
              | cut -d ":" -f 2`;

echo "This is the token recoeved $token,";
echo "will place it in /temp/SDNTOKEN file for later use.";
echo "$token" > /tmp/SDNTOKEN

Step 2) Retrieving some basic information via cURL (nodes/devices/flows)

Identically as in the previous part1 of this series where we retrieved this directly in the REST API web interface, the most important information that we are interested in are the list of switches, list of active nodes and flows from a particular switch.

/nodes – retrieving list of end nodes via cURL

The curl command for this looks as follows, it is using the token holding file from previous script and queries the controller for the nodes.

curl -sk -H "X-Auth-Token:`cat /tmp/SDNTOKEN`" \
     -H "Content-Type:application/json" \
     https://192.168.125.9:8443/sdn/v2.0/net/nodes \
| python -mjson.tool

Explanation:
The only difference here is that we are adding two header lines with two “-H” parameters, one for declaring that the content is to be JSON format and the second is adding the X-Auth-Token parameter with the inclusion of the token from the /tmp/SDNTOKEN file we created previously.

Outcome:

{
    "nodes": [
        {
            "dpid": "00:00:00:00:00:00:00:03",
            "ip": "10.10.2.1",
            "mac": "a2:3a:9d:26:39:6b",
            "port": 3,
            "vid": 0
        },
        {
            "dpid": "00:00:00:00:00:00:00:06",
            "ip": "10.10.2.254",
            "mac": "c2:76:34:44:16:44",
            "port": 3,
            "vid": 0
        }
    ]
}

/devices – retrieving a list of switches via cURL

This is again the cURL command to use:

curl -sk -H "X-Auth-Token:`cat /tmp/SDNTOKEN`" \
     -H "Content-Type:application/json" \
     https://192.168.125.9:8443/sdn/v2.0/net/devices \
| python -mjson.tool

Outcome:

{
    "devices": [
        {
            "Device Status": "Online",
            "uid": "00:00:00:00:00:00:00:03",
            "uris": [
                "OF:00:00:00:00:00:00:00:03"
            ]
        },
        {
            "Device Status": "Offline",
            "uid": "00:00:00:00:00:00:00:10",
            "uris": [
                "OF:00:00:00:00:00:00:00:10"
            ]
        },
        {
            "Device Status": "Offline",
            "uid": "00:00:00:00:00:00:00:14",
            "uris": [
                "OF:00:00:00:00:00:00:00:14"
            ]
        },
        {
            "Device Status": "Online",
            "uid": "00:00:00:00:00:00:00:06",
            "uris": [
                "OF:00:00:00:00:00:00:00:06"
            ]
        },
        {
            "Device Status": "Offline",
            "uid": "00:00:00:00:00:00:00:09",
            "uris": [
                "OF:00:00:00:00:00:00:00:09"
            ]
        },
        {
            "Device Status": "Online",
            "uid": "00:00:00:00:00:00:00:01",
            "uris": [
                "OF:00:00:00:00:00:00:00:01"
            ]
        },
        {
            "Device Status": "Offline",
            "uid": "00:00:00:00:00:00:00:08",
            "uris": [
                "OF:00:00:00:00:00:00:00:08"
            ]
        },
        {
            "Device Status": "Online",
            "uid": "00:00:00:00:00:00:00:04",
            "uris": [
                "OF:00:00:00:00:00:00:00:04"
            ]
        },
        {
            "Device Status": "Online",
            "uid": "00:00:00:00:00:00:00:05",
            "uris": [
                "OF:00:00:00:00:00:00:00:05"
            ]
        },
        {
            "Device Status": "Online",
            "uid": "00:00:00:00:00:00:00:02",
            "uris": [
                "OF:00:00:00:00:00:00:00:02"
            ]
        }
    ]
}

 /of/datapath/{dpid}/flow

This one is more interesting because you need to send  the specific switch dpid identification to the cURL request content for REST API to understand which switch you are asking for. But what DPID to choose, this is up to you, I was interested in the flow between H1 and G1 so I manually selected the DPID of S3 that is 00:00:00:00:00:00:00:03 and added it to another /tmp/SDNDPID file for temporary storage. Then I actually used two commands:

echo "00:00:00:00:00:00:00:03" > /tmp/SDNDPID
curl -sk -H "X-Auth-Token:`cat /tmp/SDNTOKEN`" \
       -H "Content-Type:application/json" \
       https://192.168.125.9:8443/sdn/v2.0/of/datapaths/`cat /tmp/SDNDPID`/flows \
| python -mjson.tool

Outcome:

{
    "flows": [
        {
            "byte_count": "15042",
            "cookie": "0xffff000000000000",
            "duration_nsec": "325000000",
            "duration_sec": 15396,
            "flow_mod_flags": [
                "send_flow_rem"
            ],
            "hard_timeout": 0,
            "idle_timeout": 0,
            "instructions": [
                {
                    "apply_actions": [
                        {
                            "output": "CONTROLLER"
                        }
                    ]
                }
            ],
            "match": [],
            "packet_count": "225",
            "priority": 0,
            "table_id": 0
        },
        {
            "byte_count": "1465",
            "cookie": "0xfffa000000002328",
            "duration_nsec": "707000000",
            "duration_sec": 1,
            "flow_mod_flags": [
                "send_flow_rem"
            ],
            "hard_timeout": 0,
            "idle_timeout": 60,
            "instructions": [
                {
                    "apply_actions": [
                        {
                            "output": 3
                        }
                    ]
                }
            ],
            "match": [
                {
                    "in_port": 1
                },
                {
                    "eth_type": "ipv4"
                },
                {
                    "ipv4_src": "10.10.2.254"
                },
                {
                    "ipv4_dst": "10.10.2.1"
                }
            ],
            "packet_count": "5",
            "priority": 29999,
            "table_id": 0
        },
        {
            "byte_count": "439",
            "cookie": "0xfffa000000002328",
            "duration_nsec": "660000000",
            "duration_sec": 1,
            "flow_mod_flags": [
                "send_flow_rem"
            ],
            "hard_timeout": 0,
            "idle_timeout": 60,
            "instructions": [
                {
                    "apply_actions": [
                        {
                            "output": 1
                        }
                    ]
                }
            ],
            "match": [
                {
                    "in_port": 3
                },
                {
                    "eth_type": "ipv4"
                },
                {
                    "ipv4_src": "10.10.2.1"
                },
                {
                    "ipv4_dst": "10.10.2.254"
                }
            ],
            "packet_count": "5",
            "priority": 29999,
            "table_id": 0
        }
    ],
    "version": "1.3.0"
}

Step 3) Pushing first flow with cURL

Ok, we know how to construct a basic cURL request towards REST API interface to retrieve information, now let’s try to influence something. I will now switch gear a little and will tell you that we will completely change the route for the H1 host communication with G1 host.

First remember the view from previous part of this series that showed the OpenFlow Topology view from the controller GUI?  In your mininet network, ping from H1(10.10.2.1) to G1(10.10.2.254) and check the “Abstract Packet” tracking again like this:

HP VAN SDN Controller 2.4.6 - path between G1 and H1 calculated by the controller alone

HP VAN SDN Controller 2.4.6 – path between G1 and H1 calculated by the controller alone

You can see that the path is using the Shortest Path First (SPF) algorithm that the controller is using to select a path on new traffic. Let’s have a look on the flow table to check how we can override this.

HP VAN SDN Controller 2.4.6 - switch 3 flow table having SPF algorithm rules with priority of 29999

HP VAN SDN Controller 2.4.6 – switch 3 flow table having SPF algorithm rules with priority of 29999

The controller is using rule sin table #0 (which is the default table as OpenFlow 1.3 standard is allowing to have multiple tables and rules jumping between them) and priority of 29999. You can think about priority right now as a form of preference for a request. If there are two rules matching a packet, the one with higher priority will be used. So what we need to do here is to insert a flow with priority of 30000 to override this.

NOTE: Alternative is that the SPF flows have quite a small idle timer of 60seconds. So if you create your flows with lower priority at the time the SPF rules already timed-out, the switch will not ask the controller for new SPF rules because it already knows what to do with the packets and will not bother to ask the controller. So feel free to experiment with the priority values and check the behavior of switches.

Constructing the flow JSON data to insert via REST API

Ok, looking at the topology, lets have a simple target that we want to add a flow to switch S3, to push packets for G1/10.10.2.254 destination out of port “2” towards switch S2. This should be easy to do, right? :) What we need is:

  1. REST API call for flows inclusion
  2. flow JSON structure to enter into this call
  3. construct cURL call to push it with HTTP POST method.
1) REST API call

The REST API function that we want to use is /of/datapath/{dpid}/flow, but the POST version which is for inserting (not reading) flows. But when you look at this method, there is no hint how to construct the required “flow” JSON fields:

HP VAN SDN Controller 2.4.6 - REST API for flow insertion

HP VAN SDN Controller 2.4.6 – REST API for flow insertion

2) “flow” JSON definition

The REST API has one very nice feature and that is that all JSON data models can be viewed in a controller URL: https://192.168.125.9:8443/sdn/v2.0/models

Please note that if you open this in default browser, you will see only a lot of unstructured text, you need a plugin to change this to a readable format. I recommend that you install JSON tools to chrome browser in order to read this in a very easy way:

EXTRA_CHrome_JSON_TOOLS

Once you have them, go to the URL https://192.168.125.9:8443/sdn/v2.0/models with Chrome and full text search how the “flow” data-structure is defined, it will be looking like this:

JSON model of "flow", note the "required" section at the bottom and the fact that OF1.0 used "actions" and OF1.1 and above uses "instructions"

JSON model of “flow”, note the “required” section at the bottom and the fact that OF1.0 used “actions” and OF1.1 and above uses “instructions” and they are not cross-compatible!

Ok, we have the structure, lets construct the JSON flow for switch S3 dpid: 00:00:00:00:00:00:00:03 , to push traffic from H1 IP: 10.10.2.1 for destination G1 IP: 10.10.2.254 out of port “2”. In addition I want to override the default priority used by the controller so my priority will be 30000 and I am also setting idle and hard timeout values for these rules to make this rule dissapear automatically after 5minutes (Warning: with hard timeout this will be deleted after 5minutes even if there is active traffic using this rule!). This is there sulting JSON specifically for this (note that I used “instructions” because I have OpenFlow 1.3 running mininet, if you have OpenFlow 1.0 use “actions” as defined above):

{
        "flow": {
                "cookie": "0x2031987",
                "table_id": 0,
                "priority": 30000,
                "idle_timeout": 300,
                "hard_timeout": 300,
                "match": [
                        {"ipv4_src": "10.10.2.1"},
                        {"ipv4_dst": "10.10.2.254"},
                        {"eth_type": "ipv4"}
                ],
                "instructions": [{"apply_actions": [{"output": 2}]}]
        }
}

Explanation:

  • cookie – this is a hexa value that you can choose youself, it has no effect on the forwarding, but for me it is usefull later when I will be looking at flowtables to differentiate between the flows I have included and flows from other applications. I choosed this value as reference to my birthday :)
  • table_id – we can have multiple tables, but since we do not require this now, lets use the default table with ID: 0
  • priority – as mentioned, to override default SPF flows with priority 29999, we choose priority of 30000
  • idle_timeout – this is a timere that if it reaches 300 seconds will remove the flow, however it gets refreshed with every packet matching this rule, so if the session is active, it will not be removed
  • hard_timeout – this timeout is strictly going to reach 300 seconds will remove this rule, ignoring if the traffic is active or not, we will use this now for experiment to avoid the need to manually clean our flows (later I will show how to remove flows via cURL)
  • match – this parameter is taking an array as input that is defined by [ ] brackets. Inside these we will defined the rules for matching this flow. See https://192.168.125.9:8443/sdn/v2.0/models and search for definition of “match” JSON structure to see all the options, right now we used only the basic ipv4_src and ipv4_dst and defined that we are looking for ipv4 traffic with eth_type.
  • instructions – another array defined by [ ] brackets, inside we will have only one action, which recursivelly also takes an array because one rule can do multiple things with the packet! and by “output”:2 we say that we want the packet to be forwarded out of port 2.
 3) cURL call to push the new flow

So we have constructed the JSON, if we use the previously showed way of adding JSON to cURL command it would look like this:

curl -ski -X POST \
     -H "X-Auth-Token:`cat /tmp/SDNTOKEN`" \
     -H "Content-Type:application/json" \
     -d '{
         "flow": {
                "cookie": "0x2031987",
                "table_id": 0,
                "priority": 30000,
                "idle_timeout": 300,
                "hard_timeout": 300,
                "match": [
                        {"ipv4_src": "10.10.2.1"},
                        {"ipv4_dst": "10.10.2.254"},
                        {"eth_type": "ipv4"}
                ],
                "instructions": [{"apply_actions": [{"output": 2}]}]
                }
          }' \
      https://192.168.125.9:8443/sdn/v2.0/of/datapaths/00:00:00:00:00:00:00:03/flows

Outcome of this command should be code “200 OK” or “201 Created” like shown below:

HTTP/1.1 201 Created
Server: Apache-Coyote/1.1
Location: https://192.168.125.9:8443/sdn/v2.0/of/datapaths/00:00:00:00:00:00:00:03/flows
Cache-Control: no-cache, no-store, no-transform, must-revalidate
Expires: Tue, 19 May 2015 18:05:36 GMT
Access-Control-Allow-Origin: *
Access-Control-Allow-Methods: GET, POST, PUT, HEAD, PATCH
Access-Control-Allow-Headers: Content-Type, Accept, X-Auth-Token
Content-Type: application/json
Content-Length: 0
Date: Tue, 19 May 2015 18:05:36 GMT

We can also have a quick view now on the OpenFlow topology and OpenFlow Monitor (flows table on S3) and you will see something like this:

HP VAN SDN Controller 2.4.6 - switch 3 redirected with our flow input

HP VAN SDN Controller 2.4.6 – switch 3 redirected with our flow input

HP VAN SDN Controller 2.4.6 - switch 3 flow table with manually added flow

HP VAN SDN Controller 2.4.6 – switch 3 flow table with manually added flow

However, the worst thing here is that if you now try to ping from H1 to G1 it will fail, the reason is that if we start doing this manually, we should do this end-to-end to satisfy connectivity. So let’s do just that ….

Step 4) Redirecting the flow end to end

I will try to have some fun here, so bear with me and let’s forward make the path this way H1->S3->S2->S5->S1->S6->G1 in a very funny loop :), but will demonstrate the power of what we are doing here. Here is the complete script, but really since I am choosing this path manually there is no really added value logic to this to justify calling it a “script”. Just consider this a list of commands for each switch in this artificial path:

#!/bin/bash
### SCRIPT TO REDIRECT H1-to-G1 via artificial path
### H1->S3->S2->S5->S1-G1

#S3 redirect
curl -ski -X POST \
     -H "X-Auth-Token:`cat /tmp/SDNTOKEN`" \
     -H "Content-Type:application/json" \
     -d '{
         "flow": {
                "cookie": "0x2031987",
                "table_id": 0,
                "priority": 30000,
                "idle_timeout": 300,
                "hard_timeout": 300,
                "match": [
                        {"ipv4_src": "10.10.2.1"},
                        {"ipv4_dst": "10.10.2.254"},
                        {"eth_type": "ipv4"}
                ],
                "instructions": [{"apply_actions": [{"output": 2}]}]
                }
          }' \
      https://192.168.125.9:8443/sdn/v2.0/of/datapaths/00:00:00:00:00:00:00:03/flows

#S2 redirect
curl -ski -X POST \
     -H "X-Auth-Token:`cat /tmp/SDNTOKEN`" \
     -H "Content-Type:application/json" \
     -d '{
         "flow": {
                "cookie": "0x2031987",
                "table_id": 0,
                "priority": 30000,
                "idle_timeout": 300,
                "hard_timeout": 300,
                "match": [
                        {"ipv4_src": "10.10.2.1"},
                        {"ipv4_dst": "10.10.2.254"},
                        {"eth_type": "ipv4"}
                ],
                "instructions": [{"apply_actions": [{"output": 4}]}]
                }
          }' \
      https://192.168.125.9:8443/sdn/v2.0/of/datapaths/00:00:00:00:00:00:00:02/flows

#S5 redirect
curl -ski -X POST \
     -H "X-Auth-Token:`cat /tmp/SDNTOKEN`" \
     -H "Content-Type:application/json" \
     -d '{
         "flow": {
                "cookie": "0x2031987",
                "table_id": 0,
                "priority": 30000,
                "idle_timeout": 300,
                "hard_timeout": 300,
                "match": [
                        {"ipv4_src": "10.10.2.1"},
                        {"ipv4_dst": "10.10.2.254"},
                        {"eth_type": "ipv4"}
                ],
                "instructions": [{"apply_actions": [{"output": 1}]}]
                }
          }' \
      https://192.168.125.9:8443/sdn/v2.0/of/datapaths/00:00:00:00:00:00:00:05/flows

#S1 redirect
curl -ski -X POST \
     -H "X-Auth-Token:`cat /tmp/SDNTOKEN`" \
     -H "Content-Type:application/json" \
     -d '{
         "flow": {
                "cookie": "0x2031987",
                "table_id": 0,
                "priority": 30000,
                "idle_timeout": 300,
                "hard_timeout": 300,
                "match": [
                        {"ipv4_src": "10.10.2.1"},
                        {"ipv4_dst": "10.10.2.254"},
                        {"eth_type": "ipv4"}
                ],
                "instructions": [{"apply_actions": [{"output": 5}]}]
                }
          }' \
      https://192.168.125.9:8443/sdn/v2.0/of/datapaths/00:00:00:00:00:00:00:01/flows

#S6 redirect
curl -ski -X POST \
     -H "X-Auth-Token:`cat /tmp/SDNTOKEN`" \
     -H "Content-Type:application/json" \
     -d '{
         "flow": {
                "cookie": "0x2031987",
                "table_id": 0,
                "priority": 30000,
                "idle_timeout": 300,
                "hard_timeout": 300,
                "match": [
                        {"ipv4_src": "10.10.2.1"},
                        {"ipv4_dst": "10.10.2.254"},
                        {"eth_type": "ipv4"}
                ],
                "instructions": [{"apply_actions": [{"output": 3}]}]
                }
          }' \
      https://192.168.125.9:8443/sdn/v2.0/of/datapaths/00:00:00:00:00:00:00:06/flows

When executing the above script, you should only get “201 Created” responses back.

NOTE: If you want, you can avoid mixing JSON to the cURL command and simply add the JSON flow definitions to a file and then call the cURL command -d parameter with the file reference like this “-d @/file_with_flow_definition.json” and you can limit this script amount of lines quite significantly.

Verification of routing is again via the SDN controller gui that should now in the OpenFlow topology show something like this (this is really great!):

HP VAN SDN Controller 2.4.6 - Complete redirection of L2 traffic in a loop from H1 to G1 via path of S3->S2->S5->S1->S6 switches

HP VAN SDN Controller 2.4.6 – Complete redirection of L2 traffic in a loop from H1 to G1 via path of S3->S2->S5->S1->S6 switches

Additionally, the ping should work in this path in mininet now (also note that because the rules exist in advance, the first ping doesn’t have the usual increased delay until controller makes a routing decision):

mininet> h1 ping g1
PING 10.10.2.1 (10.10.2.1) 56(84) bytes of data.
64 bytes from 10.10.2.1: icmp_seq=1 ttl=64 time=0.026 ms
64 bytes from 10.10.2.1: icmp_seq=2 ttl=64 time=0.032 ms
64 bytes from 10.10.2.1: icmp_seq=3 ttl=64 time=0.041 ms
^C
--- 10.10.2.1 ping statistics ---
3 packets transmitted, 3 received, 0% packet loss, time 1999ms
rtt min/avg/max/mdev = 0.026/0.033/0.041/0.006 ms


Step 5) Explicit removal of the flows you just done

On one side you can just wait 300 seconds until the hard.timeout clears our flows, but in real deployment you would definitely not used hard.timeout that often, so lets at the end look how you can remove a flow via REST API.

The easy/basic way is that you take the script shown in previous steps and only change the HTTP method from -X POST to -X DELETE and supply the same JSON description of the rule. That’s it:

curl -ski -X DELETE \
     -H "X-Auth-Token:`cat /tmp/SDNTOKEN`" \
     -H "Content-Type:application/json" \
     -d '{
         "flow": {
                "cookie": "0x2031987",
                "table_id": 0,
                "priority": 30000,
                "idle_timeout": 300,
                "hard_timeout": 300,
                "match": [
                        {"ipv4_src": "10.10.2.1"},
                        {"ipv4_dst": "10.10.2.254"},
                        {"eth_type": "ipv4"}
                ],
                "instructions": [{"apply_actions": [{"output": 2}]}]
                }
          }' \
      https://192.168.125.9:8443/sdn/v2.0/of/datapaths/00:00:00:00:00:00:00:03/flows

The correct code that should return is “204 No Content”.

The above method is however only valid for us here because we already have the JSON description of exactly the rule we want to remove, in real application when you do not know this, you would normally search the flows that exist using the REST API’s GET /of/datapath/{dpid}/flow, extract the JSON of a rule that you want removed from there (maybe by searching for the cookie value we used to identify “our” flows) and remove that.

END of Part 2/3 – Influencing Flows via cURL commands

In this part, we have demonstrated how you can via basic cURL commands do some quite significant calls from a linux bash console. The purpose here was not to tell you how to script in linux console, so all the example had only very primitive and straight-forward logic, but it should be now clear to you how to communicate with the controller this way and it is up to your imagination what you want to do with this knowledge.

Index:


Tutorial for creating first external SDN application for HP SDN VAN controller – Part 3/3: “Node Cutter” SDN application in perl with web interface

$
0
0

For best article visual quality, open Tutorial for creating first external SDN application for HP SDN VAN controller – Part 3/3: “Node Cutter” SDN application in perl with web interface directly at NetworkGeekStuff.

In this tutorial series, I will show you by example, how to build your first external REST API based SDN application for HP SDN VAN controller, with web interface for the user control. Target will be to learn how to use REST API, curl and perl scripting to generate some basic and useful code to view and also manipulate network traffic.

This article is part of “Tutorial for creating first external SDN application for HP SDN VAN controller” series consisting these articles:

In this Part 3/3, I will show you my first example SDN application that I have written just to demonstrate the combination of REST API interface with perl and the ability to have a web based interface for the user to this interface. Please note that this application is purely demonstrative on the REST API interface and basic principles, it is by no means a template for larger project because of complete lack of application based design as it was created in a “quick&dirty” way.

Prerequisites: Have the LAB from previous parts still running, we are going to use the same Mininet topology and the HP SDN VAN Controller 2.4.6

Step 1)
Install/activate Apache2 and mod_perl on it (perl CGI “Hello World”)

Both the SDNHub.org and Mininet.org VM images that I pointed you to do not by default have apache2 installed, but lucky both are ubuntu based so installing apache2 should not be a problem by simply running:

# apt-get install apache2 libapache2-mod-perl

After you have this, lets modify the default webpage apache config to enable perl files execution, open /etc/apache/sites-available/000-default.conf and add the following lines:

<VirtualHost *:80>
        ServerAdmin webmaster@localhost
        DocumentRoot /var/www/html

        <Directory  /var/www/html/>
                Options ExecCGI Indexes FollowSymLinks
                AllowOverride None
                Require all granted
                AddHandler cgi-script .cgi
        </Directory>

        <Files ~ "\.(pl|cgi)$">
                SetHandler perl-script
                PerlResponseHandler ModPerl::PerlRun
                Options +ExecCGI
                PerlSendHeader On
        </Files>
        AddHandler cgi-script .cgi

        ErrorLog ${APACHE_LOG_DIR}/error.log
        CustomLog ${APACHE_LOG_DIR}/access.log combined

</VirtualHost>

And restart apache with

# service apache2 restart

Now you should be able to run perl scripts that generate a web interface using the CGI interface of apache and mod_perl. So lets test this with a simple test file.

Create a new file inside your /var/www/html directory called “hello.cgi” and add this content to the file:

#!/usr/bin/perl

print "Content-type:text/html\r\n\r\n";
print '<html>';
print '<head>';
print '<title>Hello Word - Your first CGI/Perl Program</title>';
print '</head>';
print '<body>';
print '<h2>Hello Word! This is your first CGI program!</h2>';
print 'You should only see the printed text, not the print commands!';
print "<font size=+1>Environment</font>\n";
foreach (sort keys %ENV)
{
  print "<b>$_</b>: $ENV{$_}<br>\n";
}
print '</body>';
print '</html>';

1;

Step 2) Download and first run of NodeCutter

First point, this NodeCutter is provided as educational application with the following license:

#*
#* -------------------------------------------------------------------------------
#* "THE BEER-WARE LICENSE" (Revision 42):
#* Peter.Havrila@hp.com or phavrila@gmail.com wrote this file.  
#* As long as you retain this notice you can do whatever you want with this stuff. 
#* If we meet some day, and you think this stuff is worth it, you can buy me a 
#* beer in return.   
#*                                                            Peter Havrila, 2015  
#* ------------------------------------------------------------------------------- 
#*/

Which means that I have no other requirements than that you keep my name as the author on any derivatives and hopefully I will get a beer from random stranger in the future. However, also there is no Warranty or Liability if you use this in production environment, this is purely for LAB/study purposes.

DOWNLOAD NODE CUTTER HERE

INSTALLATION:
Inside the ZIP file, you will see that it starts with index.html and directory with several perl scripts. Simply copy all this to you apache rood directory (if you used our defaults, it should be /var/www/html ) so that the index.html is directly in the document root. E.g like this /var/www/html/index.html

FIRST RUN:
If you think you have everything now, simply open your browser of choice and go to your apache server root, if you are following my lab, it should be http://192.168.125.10/ and you should see something like this:

Node Cutter - v0.1 Entry and SDN Controller login page

Node Cutter – v0.1 Entry and SDN Controller login page

Step 2) Logging to the SDN Controller and understanding index.cgi

You might have noticed, there are some default parameters already in the login page, that is only because this program is used here as part of my LAB, if you lab is different, simply change the IP/username/password to reflect your environment.

After you have the data, click the “Submit” button. The index.cgi is a smaller of the two program perl scripts and the only role of index.cgi is to to a simple REST API call with GET to /auth and submit via JSON structure the username/password (domain is the default “sdn” hidden in the code).

If everything works, you will see a notification and also the X-Auth-Token received from the controller like this:

Node Cutter - v0.1 Entry with successful token retrieval and option to continue to main menu

Node Cutter – v0.1 Entry with successful token retrieval and option to continue to main menu

If you click on the “Continue to main menu …” button, you will be redirected will all the data (including token) to the main.cgi, but before we go there, let’s have a deeper look on index.cgi. This is the high level pseudo-code summary of how index.cgi works.

Node Cutter 0.1 - index.cgi pseudo structure

Node Cutter 0.1 – index.cgi pseudo structure

As you can notice, the blue parts are those that you see at the begininning when you are entering username/password/IP and send them via POST method back to index.cgi. The red parts are executed only if any POST data are recieved.

The red parts check the POST arguments in standard perl-cgi processing that creates a hash %FORM from them. If this form contains all the required fields, a second IF will initiate REST API call to the controller and attempts to recover the X-Auth-Token.

For completeness of this article, this is the whole index.cgi code, I enabled line numbering to help me point to interesting parts that you should look at like:

  • Lines #35-66 is the fucntion that is generating REST API and contacts the controller for token, this is the main portion you should look at here!

NOTE to help you read the code: Do NOT forget you have the option to open the code in a separate window using the “Open Code In New Window” button in the code toolbar menu. Alternatively just read the pseudo-codes I will be showing and consider this a user-guide to the application GUI only if you are not interested in the code that much.

#!/usr/bin/perl
#*
#* -------------------------------------------------------------------------------
#* "THE BEER-WARE LICENSE" (Revision 42):
#* Peter.Havrila@hp.com or phavrila@gmail.com wrote this file.  
#* As long as you retain this notice you can do whatever you want with this stuff. 
#* If we meet some day, and you think this stuff is worth it, you can buy me a 
#* beer in return.   
#*                                                            Peter Havrila, 2015  
#* ------------------------------------------------------------------------------- 
#*/

# DEBUG PRINT ENABLING VARIABLE, MAKE THIS 1 to see much mode debug lines
$bDebug=0;

# USED PACKAGES
use NetSNMP::agent (':all');
use NetSNMP::ASN qw(ASN_OCTET_STR ASN_INTEGER ASN_GAUGE ASN_TIMETICKS ASN_COUNTER ASN_OBJECT_ID ASN_COUNTER64 ASN_IPADDRESS); 
use Net::SNMP;
use Data::Dumper qw(Dumper);
use LWP::UserAgent;
use JSON;

##################
# SOME FUNCTIONS #
##################

sub dprint {
	my ($to_print) = @_;
	if (bDebug==1){
		print "$to_print";
	}
}

sub get_token { #one time check of interfaces

	my (%FORM) = @_;
	dprint "<h4>GET_TOKEN SUBROUTINE</h4>";
	#foreach my $key ( keys %FORM )
	#{
	#	my $value = $FORM{$key};
	#	print "$key : $value<br>";
	#}
	#print "<br>";

	
	if ( exists ($FORM{'username'}) && exists ($FORM{'controller_ip'}) && exists ($FORM{'password'}) )
	{
		my $url = 'https://' . $FORM{'controller_ip'} . ':8443/sdn/v2.0/auth';
		my $ua = LWP::UserAgent->new( ssl_opts => {
						verify_hostname => 0,
						SSL_verify_mode => 'SSL_VERIFY_NONE'
						} );
		my $response = $ua->post($url, 'Content' => '{"login":{"user":"' . $FORM{'username'} . '","password":"' . $FORM{'password'} . '","domain":"sdn"}}', 'Content-Type' => 'application/json');
		my $token;
		if ($response->is_success) {
                	my $json = $response->decoded_content;
	                $token = from_json ($json);
        	        $token = $token->{'record'}->{'token'};
			#print "<h2>TOKEN recieved: $token</h2>";
			return $token;
        	} else {
                	print "<h2>ERROR getting token :(, check IP or password</h2>";
        	}
	}
}

## this function I use to stransfer the whole FORM between pages 

sub generate_hidden_form_lines_from_hash {
	my (%hash) = @_;
        #print "<h4>GET_TOKEN SUBROUTINE</h4>";
        foreach my $key ( keys %hash )
        {
               my $value = $hash{$key};  
               print "<input type=\"hidden\" name=\"$key\" value=\"$value\">";
        }
        #print "<br>";
}
	
## Forumar LINK to 02_get_devices.cgi

sub get_devices {
	my (%hash) = @_;
	print "<FORM action=\"02_get_devices.cgi\" method=\"POST\">";
	generate_hidden_form_lines_from_hash(%hash);
	print "<input type=\"submit\" value=\"02_GET_ALL_DEVICES_AND_INTERFACES\"></FORM>";
}

## Forumar LINK to 03_get_nodes_and_kill_switch.cgi

sub get_nodes {
        my (%hash) = @_;
        print "<FORM action=\"03_get_nodes_and_kill.cgi\" method=\"POST\">";
        generate_hidden_form_lines_from_hash(%hash);
        print "<input type=\"submit\" value=\"03_GET_NODES_AND_KILL_SWITCH\"></FORM>";
}

sub main_menu {
        my (%hash) = @_;
        print "<FORM action=\"main.cgi\" method=\"POST\">";
        generate_hidden_form_lines_from_hash(%hash);    
        print "<input type=\"submit\" value=\"Continue to main menu ...\"></FORM>";
}	


###################################
# MAIN PART #######################
###################################
print "Content-type:text/html\r\n\r\n";
print '<html>';
print '<head>';
print '<title>Node Cutter - Controller Login Page</title>';
print '<link href=\'http://fonts.googleapis.com/css?family=Droid+Sans:400,700\' rel=\'stylesheet\' type=\'text/css\' />';
print '<link href=\'css/screen.css\' media=\'screen\' rel=\'stylesheet\' type=\'text/css\' />';
print '<link href=\'css/style.css\' rel=\'stylesheet\' type=\'text/css\' />';
# http://jsfiddle.net/vfUvZ/
print '</head>';
print '<body>';

# Main structure table 
print '<p align=center>';
print '<table><tr><td colspan=2><p align="center">';
print '<img src="images/node-cutter-logo-smaller.png">';
print '<h3> Welcome to Node Cutter!</h3>';
print 'Please enter your controller access information';
print '</p></td></tr>';

# Example FORM to enter data

print '<FORM method="POST">';
print '<tr><td><p align="right">Controller IP:</p></td><td><input type="text" name="controller_ip" value="192.168.125.9"></td></tr>';
print '<tr><td><p align="right">Username:</p></td><td><input type="text" name="username" value="sdn"></td></tr>';
print '<tr><td><p align="right">Password:</p></td><td><input type="text" name="password" value="skyline"></td></tr>';
print '<tr><td colspan=2><p align="center"><input type="submit" value="Submit"></p></td></tr>';
print '</FORM>';


# Example POST method processing

local ($buffer, @pairs, $pair, $name, $value, %FORM);
# Read in text
$ENV{'REQUEST_METHOD'} =~ tr/a-z/A-Z/;
if ($ENV{'REQUEST_METHOD'} eq "POST")
{
       read(STDIN, $buffer, $ENV{'CONTENT_LENGTH'});
     }else {
       $buffer = $ENV{'QUERY_STRING'};
} 

# Split information into name/value pairs to change it to a nice perl hash perl variable %FORM
@pairs = split(/&/, $buffer);
foreach $pair (@pairs)
{
   ($name, $value) = split(/=/, $pair);
   $value =~ tr/+/ /;
   $value =~ s/%(..)/pack("C", hex($1))/eg;
   $FORM{$name} = $value;
}

@keys = keys %FORM;
$form_size = @keys;

# Messages from the login process also go into last line of the table
print '<tr><td colspan=2><p align="center">';


# now show/do something if something arrived from the formular
if ($form_size > 0)
{
	dprint ("<h3>Your form input: $form_size</h3>");
	foreach my $key (keys %FORM)
	{
		dprint "$key: $FORM{$key}<br>";
	}

	# NOW THE ACTUAL REST API part
	if ( exists ($FORM{'username'}) && exists ($FORM{'controller_ip'}) && exists ($FORM{'password'}) )
	{
		dprint "Recieved username/controller_ip/password, continueing...";
		my $token = get_token(%FORM);
		if ($token == 1)
		{	
			goto END;
		}
		print "<h3>X-Auth-Token successfully recieved:<br><font color=green> $token</font></h3>";
		
		$FORM{'token'} = $token;
		
		#get_devices(%FORM);
		#get_nodes(%FORM);
		main_menu(%FORM);
	
		
	}
	
}

#$first_name = $FORM{first_name};
#$last_name  = $FORM{last_name};

goto SUCCESS;
END:
	printf "<h3><font color=red>X-Auth-Token NOT recieved! Check credentials or the controller status.</font></h3>";


SUCCESS:
#end of last line of table
print '</p></td></tr>';


# Main structure table END
print "</table>";
print "</p>";


print '</body>';
print '</html>';

1;

Step 3) Main menu and main.cgi structure

OK, if you are not yet fed-up by the index.cgi code, let me show you the main menu. When you arrived, this is what you should see.

Node Cutter - v0.1 Main menu initial page with readme and license

Node Cutter – v0.1 Main menu initial page with readme and license

There are only a few buttons in the menu, this is what they do:

  • Nodes to Cut – this is the main function this application is doing, when you enter here, you will get a list of Nodes that are currently known to the controller and the option to block their traffic (this is the main point of this app here).
  • Switches & Interfaces – this is a read-only function to demonstrate how to extract information from multiple parts of REST API and combine it. This one gets /net/devices for switches, net/devices/{dpdi}/ports for interfaces and also /of/stats for interface statistics and presents it as a combined overview!
  • README & License – this is a return button back this introduction page
  • Sage-refresh button – this is a BIG button to help you refresh the pages during experiments in a safe way, because sometimes if you use only F5, you can re-submit the POST command to block some node repeatedly and we wan to avoid this. So please use this one:
    NODE_Cutter_4_main_Menu_refresh_button

If you are code hungry, this is a quick representation of the main.cgi code. Technically all the buttons are POST methods and this way I am keeping the token and other usefull state data like which page to display and what action to take in a loop (yes, in real application this should be a cookie!, but POST is much more easy to understand reading the code, so after I started early with this I didn’t bothered to repair this architecture flaw as this is purely educational app!).

Node Cutter 0.1 - main.cgi pseudo-code structure to understand the code organization

Node Cutter 0.1 – main.cgi pseudo-code structure to understand the code organization

First, there are three parameters that you can configure if you want directly as a static variables at the beginning of the code.

  • $bDebug (Default value “0”) controls my dprint function that is a filtering mechanism for debug text control. If you change this value to 1, you will see much more troubleshooting and debug text appearing everywhere, but maybe inspire yourself using this dprint function instead of pure print if you are going to experiment with the code.
  • $COOKIE (Default value “0x2031987″) is an artificial value that Node Cutter is entering to all the flows it creates and it helps later identify all these rules to know if the found blocking rule was created by Node Cutter or by someone else. FYI right now this number is my birth date 😉
  • $PRIORITY (Default value “30000”), to override the controller SPF algorithm that creates rules with priority 29999, we are setting our rules at least to increment +1. NOTE: There is some problem here in going to values 30001+ for some reason, so if  you are going to experiment and mange to insert value larger than 30000, let me know.

Again, the logic of the file structure is also that blue parts are executed always, but the red parts are those that are executed depending on what arrives to them via POST method (always track the %FORM hash in the code). We only have two main chooses to do in terms of view and that is selected based on %FORM{‘view’} and only two actions of “block” and “unblock” that is selected via the %FORM{‘action’}.

Also note that for error handling, I choose to use a very simple, but ugly if this program would to become large way of using “goto” pointers. If any REST API function fails, it will print error messages and then jump at the end and stop the execution with only finishing the HTML body parts.

For main.cgi I will not show code in one view (if you want that please download the zip and open main.cgi that way) as it has ~800lines of perl and would definitely kill most of readers here. So lets have a quick view first how the Node Cutter works and then I will show the most important code snippets.

Step 4) Switches and Interfaces view

This is a read-only function, that if you click here with active network and controller you should get a fairly large table with all known SDN switches registered to the controller, and each switch that is marked as “Online” you will also get list of all its interfaces and Rx/Tx statistics for each port. This is how it looks like:

Node Cutter - v0.1 Switches & Interfaces view with several Off-line and Online switches, interfaces and statistics visible for Online switch

Node Cutter – v0.1 Switches & Interfaces view with several Off-line and Online switches, interfaces and statistics visible for Online switch

Node cutter achieves this by combining /net/devices with /net/devices/{dpid}/ports and /of/stats calls with various identifiers pushed back. The function to explore here is subrouting print_switches_and_their_interfaces, here is the code. Just have a look how it uses three REST API calls, while iterating via online switches and interfaces with some more REST API calls. In total, for large amount of switches this I expect can be quite a lot of sessions with performance impact possible in very large networks, but for campus it should be OK.

NOTE to help you read the code: Do NOT forget you have the option to open the code in a separate window using the “Open Code In New Window” button in the code toolbar menu.

# Switches and Interfaces
sub print_switches_and_their_interfaces {
        my (%FORM) = @_;
        dprint "Starting \"Switches&Interfaces\" view generation<br>";
        print "<h1>Switches & Interfaces</h1>";
        print   "<h5>In this view, the application will use REST API calls for /net/devices, 
                /net/devices/{dpid}/interfaces and /of/stats/ports to generate an overview 
                about the whole network operational status</h5>";
        print   "<br>See subroutine \"sub print_switches_and_their_interfaces {}\" 
                in the main.cgi to view the logic<br>";         
        print "====================================================<br><br>";
        ##################################
        # Retrieve the /net/devices list  
        ##################################
        print "<h2><strong>Table of REST API /net/devices</strong></h2>";
        $url = 'https://' . $FORM{'controller_ip'} . ':8443/sdn/v2.0/net/devices';
        dprint "URL constructed: $url";
        
        # these options are to avoid the self-signed certificate problems
        my $ua = LWP::UserAgent->new( ssl_opts => {     
                                verify_hostname => 0,   
                                SSL_verify_mode => 'SSL_VERIFY_NONE'
                                } ); 
        my $req = HTTP::Request->new(GET => $url);
        $req->header('content-type' => 'application/json');
        $req->header('x-auth-token' => $FORM{'token'});
        $response = $ua->request($req);
        my $devices;
        if (!($response->is_success)){
                goto WRONG_OUTPUT;
        }   
        else
        {
                dprint "Successfully got $url from controller!<br>";
                my $json = $response->decoded_content;
                $devices = from_json($json);
                
                #this is to remove the outher most {} from the JSON that only has "devices":{}
                $devices = $devices->{'devices'};
        }
        #####################################
        # We have /net/devices in my $devices
        # lets iterate via it with while(){} 
        #####################################
        my $key;   
        my $device;
        my $uptime= uptime;
        while (($key, $device) = each $devices) {
                dprint "Iteration key: $key, device: $device->{'uid'}";
                #before we start, I want the device UID and Status to be nicely starting the table:
                if ($device->{'Device Status'} eq "Online"){
                        print "<h3><strong>Device <font color=\"GREEN\">$device->{uid}</font> is <font color=\"GREEN\">ONLINE</font></strong></h3>";
                } else {
                        print "<h3><strong>Device $device->{uid} is <font color=\"RED\">OFF-LINE</font></strong></h3>";
                }

                # I actually do not want to also print the "uris' JSON part because that is dpid duplicate
                delete $device->{'uris'};
                # and print all the remaining in a quick table
                print_hash_in_table(%$device);
                ###################################
                # Now lets for each device that is 
                # "ONline" for interfaces list 
                ###################################
                if($device->{'Device Status'} eq "Online")
                {                                           
                        print "<h4><strong>INTERFACES TABLE of REST API /net/devices/<font color=\"GREEN\">$device->{uid}</font>/interfaces:</h4></strong>";
                        # Lets get the /net/devices/{dpid}/interfaces in REST API
                        $url = 'https://' . $FORM{'controller_ip'} . ':8443/sdn/v2.0/net/devices/' . $device->{uid} . '/interfaces';
                        my $token = $FORM{'token'};
                        my $req2 = HTTP::Request->new(GET => $url);
                        $req2->header('content-type' => 'application/json');
                        $req2->header('x-auth-token' => $FORM{'token'});
                        $response = $ua->request($req2);
                        if ( !($response->is_success))  
                        {
                                goto WRONG_OUTPUT;
                        }
                        else
                        {   
                                # We have the /net/devices/{dpid}/interfaces, lets print them
                                my $json = $response->decoded_content;
                                $interfaces = from_json($json);       
                                # getting again rid of the outher most {} in JSON
                                $interfaces = $interfaces->{'Interfaces'};
                                while (($key2, $interface) = each $interfaces) {
                                        dprint "Interfaces Iteration Key: $key2, Interface: $interface->{'InterfaceId'}";
                                        print_hash_in_table(%$interface);
                                        
                                        ######################################
                                        # In addition, I want port statistics!
                                        # Lets use the /of/stats/ports here   
                                        ######################################
                                        print "<p class=\"stats\">";
                                        print "<strong>Stats from /of/stats/ports?dpid=<font color=green>$device->{uid}</font>&port_id=<font color=green>$interface->{'InterfaceId'}</font></strong><br>";
                                        $url = 'https://' . $FORM{'controller_ip'} . ':8443/sdn/v2.0/of/stats/ports?dpid=' . $device->{uid} . '&port_id=' . $interface->{'InterfaceId'};
                                        my $req3 = HTTP::Request->new(GET => $url);
                                        $req3->header('content-type' => 'application/json');
                                        $req3->header('x-auth-token' => $FORM{'token'});    
                                        $response = $ua->request($req3);
                                        if ( !($response->is_success))  
                                        {
                                                goto WRONG_OUTPUT;
                                        }
                                        else
                                        {   
                                                my $json = $response->decoded_content;
                                                $stats = from_json($json);
                                                # getting again rid of the outher most {} in JSON
                                                $stats = $stats->{'port_stats'};
                                                print "Rx: $stats->{'rx_packets'} packets / $stats->{'rx_bytes'} bytes<br>";
                                                print "Tx: $stats->{'tx_packets'} packets / $stats->{'tx_bytes'} bytes<br>";
                                        }
                                        print "</p>";
                                }                                 
                        }      
                }
        print "====================================================<br><br>";                
        }                      
}

 Step 5) Nodes to Cut – first look

Ok, finally we are here, lets do the following. Open you mininet and ping from H1 (10.10.2.1) to G1 (10.10.2.254) so that there are at least these two hosts active during our next experiment.

mininet> h1 ping g1
PING 10.10.2.254 (10.10.2.254) 56(84) bytes of data.
64 bytes from 10.10.2.254: icmp_seq=1 ttl=64 time=0.359 ms
....
....

Leave the ping running as that will be our experiment for blocking/unblocking.

Now go to the “Nodes to Cut” view in the Node Cutter application and you should see something similar to this:

Node Cutter - v0.1 Nodes to Cut view, showing two detected nodes H1 and G1.

Node Cutter – v0.1 Nodes to Cut view, showing two detected nodes H1 and G1.

If you have your two nodes there, it is great! Now, make sure that the ping is still running, for me I just had a quick view:

Node Cutter - v0.1 Nodes to Cut view, ping running between H1 and G1

Node Cutter – v0.1 Nodes to Cut view, ping running between H1 and G1

 Step 6) Block node “H1″ communication

Ok, you probably noticed the big “BLOCK” button in the table, but there are also two Timeout parameters you can play with. This is the explanation:

  • Hard.Timeout – is a timeout that invalidates the blocking flow (ergo auto-unblock) after the number of seconds. Independent on activity.
  • Idle.Timeout – is also going to invalidate the blocking flow, however this timer is reset with every new packet, so if the node will “try” to communicate continuously, the flow will never be removed, on the other side, if the node will be quit for the amount of time specified, it will help him invalidate the flow.

By default there is a combination of 300seconds on both, which means that the Hard.Timeout is going to win and definitely invalidate the flow after 5minutes. Feel free to experiment.

Let’s leave the default times and click “BLOCK”, something like this should happen:

Node Cutter - v0.1 Nodes to Cut view, recieved blocking request and successfully moved node to blocking state

Node Cutter – v0.1 Nodes to Cut view, recieved blocking request and successfully moved node to blocking state

Verification: Check your running PING between H1 and G1, it should now be blocked. Also feel free to run “pingall” in mininet and you will see that H1 cannot send traffic to any of the other hosts as well.

Node Cutter - v0.1 Nodes to Cut view, blocked seconds counter

Node Cutter – v0.1 Nodes to Cut view, blocked seconds counter

NOTE: If you start using the safe-refresh button now, you can notice that Node Cutter is also tracking the flow lifetime value in seconds, this might help you determine how long until it is subject to Timeout.

Regarding main.cgi code, the whole functionality is hidden inside the “block” subroutine. This is it and if you have a quick view on it, you can notice that it is only a single JSON construction of flow definition and a single REST API call with HTTP method “POST”.

NOTE: The “flow” definition in JSON was already explained in Part2/3 of this series, so I will not repeat that here.

## Function for blocking a node
sub block {
        my (%FORM) = @_;
         
        # LETS DOUBLE-CHECK IF WE HAVE a BLOCK ACTION
        if ( exists ($FORM{'action'}) && $FORM{'action'} eq "block" )
        {
                # Lets chack if we have all the data for a successfull BLOCK
                if ( ( exists ($FORM{'ip'}) || exists ($FORM{'mac'}) ) && exists ($FORM{'dpid'}) && exists ($FORM{'token'}))
                {
                        print "<h4><font color=red>WARNING:</font>BLOCKING INSTRUCTION RECIEVED ... ";
                
                        #Lets create the JSON representation of the block flow
                        my $json = "{\"flow\":{\"cookie\": \"$COOKIE\",\"table_id\": 0,\"priority\": $PRIORITY,\"idle_timeout\": $FORM{'idle'},\"hard_timeout\": $FORM{'hard'},\"match\": [ {\"ipv4_src\": \"$FORM{'ip'}\"},{\"eth_t
                        dprint $json;
                        $url = 'https://' . $FORM{'controller_ip'} . ':8443/sdn/v2.0/of/datapaths/' . $FORM{'dpid'} . '/flows';
                        my $ua = LWP::UserAgent->new( ssl_opts => {
                                        verify_hostname => 0,
                                        SSL_verify_mode => 'SSL_VERIFY_NONE'
                                        } );
                        my $req = HTTP::Request->new(POST => $url);
                        $req->header('content-type' => 'application/json');
                        $req->header('x-auth-token' => $FORM{'token'});
                        $req->content( $json );
                        $response = $ua->request($req);
                        if ($response->is_success) {
                                print "<font color=green>SUCCESS! We are now blocking $FORM{'ip'}/$FORM{'mac'} on SWITCH $FORM{'dpid'} port $FORM{'port'} for $FORM{'hard'}/$FORM{'idle'} S/H Timeout</font>";
                        }else{
                                print "<font color=red>FAILED TO SEND BLOCKING FLOW!</font>";
                        }
                        print "</h4>";
                }
        }


}

Step 7) Unblocking node H1 communication

Because if you experimented with the Timers you can also enter “0” (zero) to make the blocking indefinite, you need a we to remove this block. You can do this after the program detects (by searching for it’s cookie value in the flow table) that a node is blocked, it gives you the “UNBLOCK” button.

Let’s try this now, but first, do you still run the ping between H1 and G1? If yes then by unblocking this communication, you will see the jump in ICMP sequence numbers that were dropped during our experiment. So let’s unblock! Click the “UNBLOCK” button.

Node Cutter - v0.1 Nodes to Cut view, unblocking node H1 success message and ping recovery after several sequence numbers blocked

Node Cutter – v0.1 Nodes to Cut view, unblocking node H1 success message and ping recovery after several sequence numbers blocked

If we look on the unblocking function “sub unblock {}” in main.cgi, you can notice that it is the same as the the block function, the only change is that the HTTP method was changed from POST to DELETE, everything else is identical with the block. Code part here:

my $req = HTTP::Request->new(DELETE => $url);

END of Part 2/3 – “Node Cutter ” perl application with web interface

So in summary, I really hope you liked this one, it took me quite some time to actually program this app for you (well, initial creation was not long, maybe 4 hours, but making it nicer anc code clean was another point!). So I hope there will be at least someone who appreciates it, if nothing else it was a great experience for me that has not motivated me to check the internal application development because the REST API despite being powerful and can help you do a lot, doesn’t give you that many functions to play with. And what was not mentioned here is that there are some “magic limits” in some places. For example natural evolution of “Node Cutter” that I wanted was to enable DSCP field editing for nodes to manipulate their QoS, but the REST API is only permitting certain DSCP values (e.g. it accepted value “12” but refused to accept value “46” and other WTF?! moments I had).

In conclusion to the whole series

This series has given you a COMPLETE introduction to SDN external application creation, even though it assumed you know already something about OpenFlow and perl, it should have been easy to follow on the REST API aspect that we explored for both direct cURL commands and then with a full example application in perl with a nice web interface. ANd the application I share with the world only under the BEER-WARE license as I only want the references and be kept mentioned as author on derivatives (and hopefully get a beer sometime …. ).

In summary, I appreciate your time (especially if someone went through all three parts). Please leave a comment if you liked it! Thanks!

Index:

Checkpoint Firewall CLI tool “dbedit” and quick lab examples

$
0
0

For best article visual quality, open Checkpoint Firewall CLI tool “dbedit” and quick lab examples directly at NetworkGeekStuff.

In this article, I am going to give you a quick guide how to run a single checkpoint FW as virtual machine quickly on your notebook and then super-quick introduction to configuring such checkpoint firewall via CLI instead of the much more typical SmartDashboard. This articles is very focused on what I personally needed to do lab for in work and is in no way a comprehensive guide to the “dbedit” tool from Checkpoint or any firewall automation.

Background

We are using Checkpoint firewalls in our customer networks at work and are heavily using SmartDashboard and other GUI based tools to manage these firewalls in a large datacenter environments (rulebase of 10k+ firewall rules!) because that is simply our internal standard. However recently there came a push to try to automate a certain aspects of configuring these firewalls because several customer wanted to achieve shorter lead-times at least on few aspects of firewall configurations.

And since Checkpoint FWs do not support any real API for managing policies with it, it came down to CLI tools like dbedit, which we will explore here a little for the purpose of learning the practicalities of managing firewall policies with this tool. The firewall automation itself is out of scope of this article, but you should get the idea what needs to be done to achieve it after learning the basics of dbedit.

Topology of our LAB and LAB components

For this lab I was using GNS3 and VirtualBox to create my small topology, but your should be perfectly fine to use vmWare workstation with only logical interfaces from it (the vmnetX interfaces it creates) to simulate the same logic, the focus here is to manipulate the FW rules with dbedit tool, so I am not even going to do FW cluster or install Domain Management Systems (MDS) as a typical Checkpoint production environment should have.

Checkpoint LAB topology, using R77.20 release installed inside VirtualBox VM host

Checkpoint LAB topology, using R77.20 release installed inside VirtualBox VM host

Checkpoint Components used

In regards to Checkpoint software used here, I only used the 15 day trials as these are fully functional for this period and enough for a quick LAB. However even to download these, you need a partners account or any other checkpoint product, so here I need to ask you to check in what way you can download this software as for me it was easy thanks to my employer being a partner with Checkpoint so I have this access.

From the following download page for R77.20 of checkpoint:
https://supportcenter.checkpoint.com/supportcenter/portal?eventSubmit_doGoviewsolutiondetails=&solutionid=sk101208

Step 1. Download

  1. VMWare Virtual Machine OVF Template
    Check_Point_Security_Gateway_R77.20_T124_OVF_Template_Gaia.tgz
  2. SmartDashboard and other GUI management components for Windows
    Windows – SmartConsole and SmartDomain Manager [INSTALL EXE package]

Step 2. Unpack & Install R77.20 into VirtualBox VM

Unpack the downloaded Check_Point_Security_Gateway_R77.20_T124_OVF_Template_Gaia.tgz, inside will be an OVF packaged virtual machine files that should be easy to import into VirtualBox or vmWare Workstation. Please do so.

Afterwards run the VM and follow install wizard. On this point you can do this even without GNS3 or other network around, but since in next steps immediately setting the interfaces, I recommend that you already put this VM in middle of your virtual network to test access to the VM interfaces.

Step 3. Basic CLI configuration of Checkpoint FW interfaces

After your new VM firewall is booted, we are going to configure its interfaces with IPs as basic first step. I am going to use:
eth1 – external bridge to GNS3 virtual LAN with 192.168.177.2/24 IP
eth0 – internal “host only” adapter that will simulate our corporate intranet with 192.168.125.20/24 IP

Open the checkpoint CLI console in VirtualBox and login with the default “admin” username and “admin” password.

set interface eth0 ipv4-address 192.168.125.20 subnet-mask 255.255.255.0
set interface eth1 ipv4-address 192.168.177.2 subnet-mask 255.255.255.0
set interface eth0 state on
set interface eth1 state on

Step 4. First time setup via WebGUI

Simply open a browser, and go to https://192.168.125.20/ and complete the first time configuration wizard. It will ask you for very basic things like what packages to install (Select all), if you are installing a Secure Gateway or MDS (here answer that you are installing Secure Gateway) and that this system is either not part or will be part of a VRRP cluster later.

Simply try to push everything to as much stand-alone minimal firewall deployment possible.

Step 5. Setup initial routing, initial sample ruleset and simple NAT

Step 5.1 IPv4 Static Route

Routing is practically not needed here, but if nothing else please setup a default gateway (or default route) towards your external inteface next hope (the router on the other side0. This is simply done via the WebGUI -> Ipv4 Static Routes and add it, example below.

Static Route via WebGUI of Checkpoint Gaia

Static Route via WebGUI of Checkpoint Gaia

Step 5.2 Simple FW policy

To configure FW policy and/or NAT in the next step, you have to install the SmartDashboard 77.20 client on your windows host, launch it and point to to your virtual checkpoint firewall IP  and the new admin username/password you created during your first-time-configuration in step #3 (since the admin/admin might not be valid here anymore).

SmartDashboard 77.20 login screen

SmartDashboard 77.20 login screen

Inside the SmartDashboard, on the top-left side navigate to the “Policy” section. This GUI is very intuitive, create a few rules with a few new network objects in the background. I am not going to give a full guide here as this is not a Checkpoint FW tutorial for SmartDashboard but simply try to create a few basic rules as I have just to have something to play later with.

Basic FW policy structure with managment / base rules / default rules / automated / non-automated and default DENY collector rules

Basic FW policy structure with managment / base rules / default rules / automated / non-automated and default DENY collector rules

In the above ruleset I have created a sample rule (very primitive really) of what we use in production. We have management rules first, then comes base rules (rules needed for servers to operate like logging), then default rules (used for each security zone like default flat access), then new section of automate rules that we want to later work with using dbedit/CLI. Followed by a section of non-automated rules and DENY ANY collector rule.

#IMPORTANT! See above the rule index numbers, from this vie it looks like rules are numbered from #1 to #7, however in the dbedit and CLI, these rules are practically indexed starting from #0, but allso the comment sections are using an index, which means that there rules will be in CLI later edited using indexes of #0 – #12 (the DENY ANY rule at the end is practically rule #12 in CLI!!). This can confuse very much so remember this from this point.

Step 5-3. Configure basic NAT rule to hide internal network behind external interface IP

This is the same NAT (or in Cisco terminology PAT) that will hide the internal network behind behind this firewall. I used this because in both my LAB networks I didn’t wanted to change the routing for this exercise so everything that transits from internal 192.168.125.0/24 network to external networks is hidden behind the 192.168.177.2 IP of the eth1 interface of the FW.

Configuring this is a single NAT rule, in the SmartDashboard top-left part, select the “NAT” section and create the following rule:

New NAT rule to hide internal network behind single translated source of the firewall IP

New NAT rule to hide internal network behind single translated source of the firewall IP, additionally, open the “NAT Method..” to activate PAT

Additionally, as shown above, select the Translated Source with right-click and select the “NAT Method…” and as shown below, switch to “Hide”. Otherwise your policy application will fail because by default Checkpoint wants to do a static one-to-one NAT and here we need to have a one-to-many NAT which is hiding the whole network behind one IP.

New NAT rule to hide internal network behind single translated source of the firewall IP

New NAT rule to hide internal network behind single translated source of the firewall IP

After all is done, hit the “Install Policy” button and hope all is accepted.

Step 6. Preparing access to CLI expert mode

dbedit is accessible from expert mode of checkpoint FW, to access this, you first need to configure password access to it with the below command  executed in the checkpoint CLI:

set expert-password

The system is going to ask you to enter new password like below screenshot from my system:

6_set_expert_mode

and afterwards you can enter the expert mode with the command

expert

in my system then :

checkpointvirtualGW> expert
Enter expert password:

Warning! All configuration should be done through clish
You are in expert mode now.
 
[Expert@checkpointvirtualGW:0]#

Step 7.Entering dbedit

When you are in expert mode (check that your CLI prompt ends with “#” and you actually have many unix commands available), we can now enter the dbedit,

You can use dbedit in two modes, interactive mode that we will use here, but there is also a batch processing mode where you can store your dbedit commands in a text file and then execute all at once using the “-f” parameter and the text file as argument. However in this guide we are going to use interactive mode (the default one).

Enter dbedit simply by typing dbedit in the CLI, you should get output similar to this:

[Expert@checkpointvirtualGW:0]# dbedit 
Enter Server name (ENTER for 'localhost'): 

Please enter a command, -h for help or -q to quit: 
dbedit>

 #IMPORTANT!: I actually recommend that (and it is actually mandatory to edit FW policy) that you close any SmartDashboard sessions that you have with the checkpoint FW as dbedit needs an explicit lock on policy editing to do real work. To make this explicit, I recommend using dbedit always with parameter “-globallock” as in the example below, this will ask dbedit to make explicit lock of the policy editing to dbedit, this will fail if any other SmartDashboad and/or other dbedit sessions are running.

[Expert@checkpointvirtualGW:0]# dbedit -globallock
Enter Server name (ENTER for 'localhost'): 

Please enter a command, -h for help or -q to quit: 
dbedit>

Step 8. FINAL – dbedit exercises

EXERCISE A – basic print examples

dbedit is definitely not much user friendly when it comes to printing network objects or the fw policies using the CLI, therefore I actually recommend that you open a SmartDashboard, but in “read-only” mode to the FW so that you can search for object definitions and verify your policy changes with it in a much more visually friendly way.

dbedit provides two basic print commands, print and printxml, they do the same only the output is in xml format with the second one. The syntax is roughly:

print <table_name> <object_name>
printxml <table_name> <object_name>

For both however, you will have to learn some basic ways how dbedit calls various objects, when we get to editing in later excercises, you can get back to print commands and use it with the network objects we create later to display them.

For now, the two examples you can try:

dbedit > print H_FAKE_1.1.1.1
note:
the H_FAKE_1.1.1.1 is one of the host object definitions I have created during policy creation in previous steps, if you have somethign different, change this to any other object that you have in your policy.

dbedit> print network_objects H_FAKE_1.1.1.1
          
          Object Name: H_FAKE_1.1.1.1
          Object UID: {30DE66BD-8F54-4B2A-95A5-E59A30B6E2EA}
          Class Name: host_plain
          Table Name: network_objects
          Last Modified by: admin
          Last Modified from: HAVRILA2
          Last Modification time: Fri Feb 26 16:22:01 2016
          Fields Details
          --------------
              DAG: false
              NAT: (
                  <NULL>
              )
              SNMP: (
                  <NULL>
              )
              VPN: (
                  <NULL>
              )
              add_adtr_rule: false
              additional_products: (
                  <NULL>
              )
              addr_type_indication: IPv4
              certificates: (
                  (
                      <NULL>
                  )
              )
              color: black
              comments: 
              connectra: false
              connectra_settings: (
                  <NULL>
              )
              cp_products_installed: false
              data_source: not-installed
              data_source_settings: (
                  <NULL>
              )
              edges: 
              enforce_gtp_rate_limit: false
              firewall: not-installed
              floodgate: not-installed
              gtp_rate_limit: 2048
              interfaces: (
                  (
                      <NULL>
                  )
              )
              ipaddr: 1.1.1.1
              ipaddr6: 
              macAddress: 
              os_info:  (
                  osBuildNum: 
                  osName: Gaia
                  osSPMajor: 
                  osSPMinor: 
                  osType: 0
                  osVerMajor: 
                  osVerMinor: 
                  osVersionLevel: 
              )
              type: host

The second example you can try is to display the whole FW policy with:

dbedit> print fw_policies ##Standard

however this output is very long even for the policy shown in, so just for your comparison, this policy SmartDashbord screenshot is represented by this dbedit print output in TXT file.

EXERCISE B – disabling a simple rule from the policy

Our first example of editing a policy we keep simple, I will simply disable the last “DENY ANY” rule in my policy. In SmartDashboard, the last rule is #7, however, as explained above, dbedit is indexing rules starting with 0 and also the section names are considered an indexed output from the policy, so if you count everything from the policy I have, the last rule is actually #12!! You can doublecheck this using the print commands from previous excercise, but there is no index there, so you have to manually count the number of rules printed, what is error prone…. as I said, dbedit was not meant for visual human readability.

The one command that we need to edit the policy and change the rule 12 into disabled state is:

dbedit> modify fw_policies ##Standard rule:12:disabled true

after this command, the sequence of commands that we will use to update the policy and install it into firewalls is:

dbedit> update_all
dbedit> savedb

to install the policy, you need to exit the dbedit using the quit command, and from expert mode launch:

dbedit> quit
[Expert@checkpointvirtualGW:0]# fwm load Standard

Here is a full output of all the messages that follow a successfully update of policy, saving the db and loading the firewall with the new policy.

dbedit> modify fw_policies ##Standard rule:12:disabled true
dbedit> update_all
fw_policies::##Standard Updated Successfully
dbedit> savedb
Database saved successfully
dbedit> quit
[Expert@checkpointvirtualGW:0]# fwm load Standard 
Installing policy on R77 compatible targets:
  Warning: Anti-Spoofing is not configured for some interfaces and gateways. 
  This will allow address spoofing through these gateways.
 Anti-Spoofing should be configured on the following objects:
 Gateway: checkpointvirtualGW, Interface: eth2
 Gateway: checkpointvirtualGW, Interface: eth1
 Gateway: checkpointvirtualGW, Interface: eth0
 Standard.W: Security Policy Script generated into Standard.pf
 export Standard.Set:
 Compiled OK.
 Standard:
 Compiled OK.
 export Standard.Set:
 Compiled OK.
 Standard:
 Compiled OK.
 Installing Security Gateway policy on: checkpointvirtualGW ...
  Security Gateway policy installed successfully on checkpointvirtualGW...
  
 Security Gateway policy installation complete
 Security Gateway policy installation succeeded for:
 checkpointvirtualGW

And now the final view, in the SmartDashboard in read-only mode, reload the policy and you should see the last rule disabled:

FW policy with the last rule #7 (#12 from dbedit indexing) disabled

FW policy with the last rule #7 (#12 from dbedit indexing) disabled

EXERCISE C – creating a few new network objects

Just to give you a reference point to creating network objects (before we jump into policy editing), here are a few examples of basic operations:

– NEW NETWORK  OBJECT

# Create the object (of type network)
    create network net10-internal
    # Configure the network IP address
    modify network_objects net10-internal ipaddr 10.0.0.0
    # Configure the netmask (in dotted decimal notation) of the network
    modify network_objects net10-internal netmask 255.0.0.0
    # Add a comment to describe what the object is for (optional)
    modify network_objects net10-internal comments "Created by networkgeekstuff with dbedit"

– NEW HOST  OBJECT

# Create the actual object (of type host_plain)
    create host_plain PC1host
    # Modify the host IP address
    modify network_objects PC1host ipaddr 192.168.125.10
    # Add a comment to describe what the object is for (optional)
    modify network_objects PC1host comments "Created by fwadmin with dbedit"

#OPTIONAL NEW HOST#2, just one more time to help the next excercises with grouping multiple objects

# Create the actual object (of type host_plain)
    create host_plain PC2host
    # Modify the host IP address
    modify network_objects PC2host ipaddr 192.168.125.15
    # Add a comment to describe what the object is for (optional)
    modify network_objects PC2host comments "Created by fwadmin with dbedit"

– NEW ADDRESS RANGE OBJECT

# Create the actual object (of type address_range)
    create address_range dbedit_IP_range
    # Modify the first IP address in the range
    modify network_objects dbedit_IP_range ipaddr_first 192.168.125.100
    # Modify the last IP address in the range
    modify network_objects dbedit_IP_range ipaddr_last 192.168.125.110
    # Add a comment to describe what the object is for (optional)
    modify network_objects dbedit_IP_range comments "IP range for dbedit"

– RENAME OBJECT

# Rename the network object addr-range to IPv4-range
    rename network_objects dbedit_IP_range IPv4-range

– DELETE OBJECT

# Delete the network object addr-range
    delete network_objects IPv4-range

– CREATING NETWORK GROUPS

# Create a group object
    create network_object_group dbedit_host_group

– Add the individual elements to the group

addelement network_objects dbedit_host_group '' network_objects:PC1host
    addelement network_objects dbedit_host_group '' network_objects:PC2host

–  Remove individual elements from the group

rmelement network_objects dbedit_host_group '' network_objects:PC2host

EXERCISE D – removing a rule, and adding a new rule at the end of policy

We will continue to play with the last deny any rule for a little longer, we are now going to delete it, and then put it back (optionally with PERMIT ANY if you want). Again, return back to the dbedit, to make this quicker I am now going to only show the commands needed and will minimize the text around it :).

Remove the deny any rule with #12

dbedit> rmbyindex fw_policies ##Standard rule 12

in the usual way, do the update_all, savedb commands in dbedit, then exit dbedit and install policy from expert mode using the fwm load Standard. The result will be that in your policy the last rule will be removed.

FW policy with the last deny all rule removed

FW policy with the last deny all rule removed

To put the rule back, e.g. create a new rule, return to dbedit and use these commands that are the minimum commands to describe a new rule with deny any:

#creates empty rule at the end, you have to change the #12 to your rule base!!!
addelement fw_policies ##Standard rule security_rule
modify fw_policies ##Standard rule:12:comments "Deny All RULE - dbedit"
modify fw_policies ##Standard rule:12:disabled false
addelement fw_policies ##Standard rule:12:action drop_action:drop
addelement fw_policies ##Standard rule:12:src:'' globals:Any
addelement fw_policies ##Standard rule:12:dst:'' globals:Any
addelement fw_policies ##Standard rule:12:services:'' globals:Any

OPTIONAL, activate Log tracking on the rule:

rmbyindex fw_policies ##Standard rule:12:track 0
addelement fw_policies ##Standard rule:12:track tracks:Log

OPTIONAL, if you by chance want, change from DROP to PERMIT ANY

rmbyindex fw_policies ##Standard rule:12:action 0
addelement fw_policies ##Standard rule:12:action accept_action:accept

in the usual way, do the update_all, savedb commands in dbedit, then exit dbedit and install policy from expert mode using the fwm load Standard. The result will be similar to the picture below.

FW policy with edited two rules in the middle of the policy

FW policy with edited two rules in the middle of the policy

EXERCISE E – Editing existing rule

The last exercise here is that we will edit an existing rule by adding more network objects to the source and destination parts.

#IMPORTANT!: If you are asking why were are not adding new rule to the middle of the policy then please note that this is not easily possible. dbedit is only capable of adding a new rule to the end of the policy, this means that if you have a ruleset of five rules (#0-#4) and you want to enter a new rule that will be, lets say, second (#2), you need to delete rules #2-#4, add your rule and then re-create the deleted rules again as new rules #3-#5 behind your newly inserted rule #2.

Let’s  now  do something like editing an existing rule and I will use the two rules I pre-created for this purpose in my policy #4(7 for dbedit) source and #5(8 for dbedit) and I will add more items to the source and destination parts.

Adding more source objects:

addelement fw_policies ##Standard rule:7:src:'' network_objects:PC1host
addelement fw_policies ##Standard rule:7:src:'' network_objects:PC2host

Adding more destination objects:

addelement fw_policies ##Standard rule:8:dst:'' network_objects:dbedit_host_group

OPTIONAL #1, you can remove the unneeded parts from the rule in a similar way:

rmelement fw_policies ##Standard rule:7:src:'' network_objects:H_FAKE_1.1.1.1
rmelement fw_policies ##Standard rule:8:dst:'' network_objects:H_FAKE_2.2.2.2

OPTIONAL #2, if you need to change the logic of a rule field to a negation (ergo “not containing XY”) you can do so like this:

modify fw_policies ##Standard rule:8:dst:op 'not in'

Summary

What to say, dbedit is the only tool I currently see that at least in a limited way will allow us to automate a portion of the firewall policy, however due to the problematic insertion of new rules I am much more expecting a semi-automated solution where rule templates will exist, while automated script is only adding systems to the source/destination part of pre-existing template rules. We will see, at this point this was just a quick introduction to the dbedit as a summary of my quick LAB I did and maybe will be interesting for someone else.

REFERENCES

Checkpoint Gaia web admin documentation:
https://sc1.checkpoint.com/documents/R76/CP_R76_Gaia_WebAdmin/75697.htm

Checkpoint R77 CLI command reference guide:
https://sc1.checkpoint.com/documents/R77/CP_R77_CLI_ReferenceGuide_WebAdmin/index.html


[minipost] Windows partition editing with diskpart

$
0
0

For best article visual quality, open [minipost] Windows partition editing with diskpart directly at NetworkGeekStuff.

This will really be a micro-post as I only want to document this for my benefit. This is a way how to change partition table for disks, or USB sticks. In my example, I had a linux live boot USB stick that I needed to quickly convert into a usable storage USB stick with NTFS under windows and of course the visual GUI tools under My Computer -> Manage -> Disk Management was not having full visibility on all partitions that the linux created on this USB stick, so this is how to actually do partitioning on windows.

So without more delay, this is an example how to clean the USB stick partition table and reformat it for windows use:

  1. start command prompt as Administrator and type “diskpart”
  2. enter “list disk”
  3. enter “select disk X”, where X is the and number of your USB stick ( ergo “select disk 1″ )
  4. enter “clean”
  5. enter “create partition primary”
  6. enter “select partition 1″
  7. enter “active”
  8. enter “format quick fs=ntfs”
  9. enter “assign”
  10. enter “exit”  to leave diskpart

In summary, short, but hopefully useful minipost for someone.

[minipost]Quick LAB/config example for IPv6 BGP between HP Networking Comware v5 andCisco

$
0
0

A small lab showing basic configuration of BGP between Cisco and HP (Comware v5). This is just something small we deploying recently, there is nothing grand here, only a minor configuration example to follow later when needed.

NOTE on HP Comware v5  vs newer Comware v7, I understand I am using older version of the operating system on HP devices, the point is that this article is using one of my real work projects where Comware v5 was used without possibility to upgrade. However ALL Ipv6 functions that we needed were provided already on this older Comware, and when I checked, Comware v7 variant of this LAB is only changing commands syntax (actually quite easy to convert from v5 to v7 only following the “?”), therefore this article will remain in Comware v5 and I believe many readers will take the principles and will have no problem to upgrade to Comware v7 on their own.

Lab Topology:

This is a simple topology that is trying to simulate a typical L3 Edge / Distribution / Access with several HP 5800 layer3 switches and Cisco 3750 is simulating a typical WAN provider with dual-homing access. Of course all with limits of my LAB equipment. The target is to have full routing between the IPv6 Loopback on HP L3 Access and two Loopbacks on Cisco side simulating WAN destinations.

LAB Topoplogy used to present IPv6 and BGP between HP Networking Comware v5 and Cisco IOS boxes

LAB Topoplogy used to present IPv6 and BGP between HP Networking Comware v5 and Cisco IOS boxes

Part 1: Preparing cisco for IPv6

In my lab, I used my 3750 layer 3 switches. On these boxes, I had IPv6 support, but I needed to activate the IPv6 configurations via Switch Database Management (SDM) templates. This is something that controls resource allocation and by default doesn’t give any system resources to IPv6 functionality. To actually activate IPv6, you need to activate dual IPv4/IPv6 template and reload the switch. So we are going to do just that here:

3750# ip routing
3750# ip cef distributed
3750# show sdm prefer
 The current template is "desktop default" template.
 The selected template optimizes the resources in
 the switch to support this level of features for
 8 routed interfaces and 1024 VLANs. 

  number of unicast mac addresses:                  6K
  number of IPv4 IGMP groups + multicast routes:    1K
  number of IPv4 unicast routes:                    8K
    number of directly-connected IPv4 hosts:        6K
    number of indirect IPv4 routes:                 2K
  number of IPv4 policy based routing aces:         0
  number of IPv4/MAC qos aces:                      0.75K
  number of IPv4/MAC security aces:                 1K

3750(config)#sdm prefer ?
  access              Access bias
  default             Default bias
  dual-ipv4-and-ipv6  Support both IPv4 and IPv6
  ipe                 IPe bias
  routing             Unicast bias
  vlan                VLAN bias 

3750(config)#sdm prefer dual-ipv4-and-ipv6 ?
  default  Default bias
  routing  Unicast bias
  vlan     VLAN bias

3750(config)#sdm prefer dual-ipv4-and-ipv6 routing 
Changes to the running SDM preferences have been stored, but cannot take effect 
until the next reload.
Use 'show sdm prefer' to see what SDM preference is currently active.

3750(config)#do reload

and after reboot:

3750(config)#ipv6 unicast-routing
3750(config)#ipv6 cef

real config

T6_CiscoL3-2(config)#router bgp 64512

T6_CiscoL3-2(config-router)#bgp router-id 6.6.6.6

T6_CiscoL3-2(config-router)#no bgp default ipv4-unicast 

T6_CiscoL3-2(config-router)#neighbor 2a02:d200::0:1 remote-as 64512

T6_CiscoL3-2(config-router)#address-family ipv6 unicast 

T6_CiscoL3-2(config-router-af)#neighbor 2a02:d200::0:1 activate 

T6_CiscoL3-2(config-router-af)#network AAAA::2/128

after the same done on the oposite T5_CiscoL3-1, on T6 you can see the routes coming from the loopback:

T6_CiscoL3-2(config-router-af)#do sh ipv6 route
IPv6 Routing Table - Default - 5 entries
Codes: C - Connected, L - Local, S - Static, U - Per-user Static route
       B - BGP, R - RIP, D - EIGRP, EX - EIGRP external
       ND - Neighbor Discovery
       O - OSPF Intra, OI - OSPF Inter, OE1 - OSPF ext 1, OE2 - OSPF ext 2
       ON1 - OSPF NSSA ext 1, ON2 - OSPF NSSA ext 2
C   2A02:D200::/126 [0/0]
     via FastEthernet1/0/11, directly connected
L   2A02:D200::2/128 [0/0]
     via FastEthernet1/0/11, receive
B   AAAA::1/128 [200/0]
     via 2A02:D200::1
LC  AAAA::2/128 [0/0]
     via Loopback0, receive
L   FF00::/8 [0/0]
     via Null0, receive

You can also ping the BGP route for a test.

Step 2 – creating Cisco to HP BGP sessions

Cisco part T6 example:

T6_CiscoL3-1(config-router)#neighbor 2a02:d200::2:2 remote-as 65100
T6_CiscoL3-1(config-router)#address-family ipv6
T6_CiscoL3-1(config-router-af)#neighbor 2a02:d200::2:2 activate

H3C part TS4 example:


[TS4_HP5800]ipv6 

[TS4_HP5800]ip vpn-instance IPv6DMZ
[TS4_HP5800-vpn-instance-IPv6DMZ]route-distinguisher 65100:65100


[TS4_HP5800-4]interface GigabitEthernet 1/0/22
[TS4_HP5800-GigabitEthernet1/0/22]ip binding vpn-instance IPv6DMZ
[TS4_HP5800-GigabitEthernet1/0/22]port link-mode route
[TS4_HP5800-GigabitEthernet1/0/22]ipv6 address 2a02:d200::2:2/126

[TS4_HP5800-GigabitEthernet1/0/22]ping ipv6 -vpn-instance IPv6DMZ 2a02:d200::2:1        
  PING 2a02:d200::1:1 : 56  data bytes, press CTRL_C to break
    Reply from 2A02:D200::1:1 
    bytes=56 Sequence=1 hop limit=64  time = 40 ms
    Reply from 2A02:D200::1:1 
    bytes=56 Sequence=2 hop limit=64  time = 6 ms
    Reply from 2A02:D200::1:1 
    bytes=56 Sequence=3 hop limit=64  time = 43 ms
    Reply from 2A02:D200::1:1 
    bytes=56 Sequence=4 hop limit=64  time = 23 ms
    Reply from 2A02:D200::1:1 
    bytes=56 Sequence=5 hop limit=64  time = 10 ms

  --- 2a02:d200::1:1 ping statistics ---
    5 packet(s) transmitted
    5 packet(s) received
    0.00% packet loss
    round-trip min/avg/max = 6/24/43 ms


Now on H3C we need to initiate the BGP parts

[TS4_HP5800]bgp 65100
[TS4_HP5800-bgp]router-id 4.4.4.4
[TS4_HP5800-bgp]ipv6-family
[Ts1_5800-bgp-af-ipv6] undo synchronization
[Ts1_5800-bgp-af-ipv6] quit
[TS4_HP5800-bgp]ipv6-family vpn-instance IPv6DMZ 
[TS4_HP5800-bgp-ipv6-IPv6DMZ]peer 2a02:d200::2:1 as-number 64512 
%Apr 26 12:44:55:001 2000 TS4_HP5800 BGP/5/BGP_STATE_CHANGED: 
 2A02:D200::2:1 state is changed from OPENCONFIRM to ESTABLISHED.

[TS4_HP5800-bgp-ipv6-IPv6DMZ]display ipv6 routing-table vpn-instance IPv6DMZ
Routing Table : IPv6DMZ
        Destinations : 6        Routes : 6

Destination: ::1/128                                     Protocol  : Direct
NextHop    : ::1                                         Preference: 0
Interface  : InLoop0                                     Cost      : 0

Destination: 2A02:D200::2:0/126                          Protocol  : Direct
NextHop    : 2A02:D200::2:2                              Preference: 0
Interface  : GE1/0/22                                    Cost      : 0

Destination: 2A02:D200::2:2/128                          Protocol  : Direct
NextHop    : ::1                                         Preference: 0
Interface  : InLoop0                                     Cost      : 0

Destination: AAAA::1/128                                 Protocol  : BGP4+
NextHop    : 2A02:D200::2:1                              Preference: 255
Interface  : GE1/0/22                                    Cost      : 0

Destination: AAAA::2/128                                 Protocol  : BGP4+
NextHop    : 2A02:D200::2:1                              Preference: 255
Interface  : GE1/0/22                                    Cost      : 0

Destination: FE80::/10                                   Protocol  : Direct
NextHop    : ::                                          Preference: 0
Interface  : NULL0                                       Cost      : 0

Ok, great, now we have a BGP peering between Cisco and H3C established, and the HP routers see the Cisco Loopback interfaces.

SKIP – more VLANs, more basic BGP sessions and we jump to TS1/TS2 and MSR VRRPv6 groups

Step 3 – Configuring VRRP for IPv6 on H3C

This is a small extra on enabling servers access to our topology with VRRP, which functions only a little bit different on IPv6 as it uses link-local addresses for negotiation and global unicast IPv6 addresses are negotiated on top of this negotiation.

First, lets just configure the basic IPv6 VRRP in global and have a look on the interface with which we are starting here.

[Ts1_5800]vrrp ipv6 method virtual-mac
[Ts1_5800]vrrp ipv6 ping-enable

[Ts1_5800-GigabitEthernet1/0/22]display this
#
interface GigabitEthernet1/0/22
 port link-mode route
 ip binding vpn-instance IPv6DMZ
 ipv6 address 2A02:D200::5:A/124
#

Next, what we need to realize is that in the broadcast domain where we want VRRP to function, we need to enable link-local IPv6 addresses first (these are the FE80::/10). We do this by simply enabling the auto configuration and then checking the interface. In the picture below we autoconfigured the FE80::BAAF:67FF:FE22:C47E as our link-local IP :

[Ts1_5800-GigabitEthernet1/0/22] ipv6 address auto
[Ts1_5800-GigabitEthernet1/0/22] quit

[Ts1_5800]display ipv6 interface g1/0/22
GigabitEthernet1/0/22 current state :UP
Line protocol current state :UP
IPv6 is enabled, link-local address is FE80::BAAF:67FF:FE22:C47E
  Global unicast address(es):
    2A02:D200::5:A, subnet is 2A02:D200::5:0/112
  Joined group address(es):
    FF02::12
    FF02::1:FF05:0
    FF02::1:FF05:A
    FF02::1:FF22:C47E
    FF02::2
    FF02::1
  MTU is 1500 bytes
  ND DAD is enabled, number of DAD attempts: 1
  ND reachable time is 30000 milliseconds
  ND retransmit interval is 1000 milliseconds
  Hosts use stateless autoconfig for addresses
IPv6 Packet statistics:
  InReceives:                   1595
  InTooShorts:                  0
  InTruncatedPkts:              0
  InHopLimitExceeds:            0
  InBadHeaders:                 0

You can see that we now have a link-local IP of FE80::BAAF:67FF:FE22:C47E, we can move to VRRP configuration itself. First, we need to create a link-local VRRP IP with the typical virtual router ID (1-255). So lets choose vrid of 5 and the link-local address lets choose for simplicity “FE80::1”.

[Ts1_5800-GigabitEthernet1/0/22] vrrp ipv6 vrid 5 virtual-ip FE80::100 link-local

Only after this, we can create the globally unique VRRP IP with a second command:

[Ts1_5800-GigabitEthernet1/0/22] vrrp ipv6 vrid 5 virtual-ip 2A02:D200::5:100

In summary, this is the interface configuration on the interface.

[Ts1_5800-GigabitEthernet1/0/22]display this
#
interface GigabitEthernet1/0/22
 port link-mode route
 ip binding vpn-instance IPv6DMZ
 ipv6 address 2A02:D200::5:A/112
 ipv6 address auto
 vrrp ipv6 vrid 5 virtual-ip FE80::100 link-local
 vrrp ipv6 vrid 5 virtual-ip 2A02:D200::5:100
#

Verification is with the typical “display vrrp” commands, but with IPv6 extension, please note that in the quick view with “display vrrp ipv6” you only see the link-local IPv6, the global unicast one is hidden under the verbose version of this command.

[Ts1_5800]display vrrp ipv6
 IPv6 Standby Information:
     Run Mode       : Standard
     Run Method     : Virtual MAC
 Total number of virtual routers : 1
 Interface          VRID   State       Run     Adver   Auth     Virtual
                                       Pri     Timer   Type        IP
 ---------------------------------------------------------------------
 GE1/0/22           5      Backup      100     100     None     FE80::100

[Ts1_5800]display vrrp ipv6 verbose 
 IPv6 Standby Information:
     Run Mode       : Standard
     Run Method     : Virtual MAC
 Total number of virtual routers : 1
   Interface GigabitEthernet1/0/22
     VRID           : 5               Adver Timer : 100
     Admin Status   : Up              State       : Backup
     Config Pri     : 100             Running Pri : 100
     Preempt Mode   : Yes             Delay Time  : 0
     Become Master  : 2800ms left
     Auth Type      : None
     Virtual IP     : FE80::100
                      2A02:D200::5:100
     Master IP      : FE80::BAAF:67FF:FE3D:7FC2

By default, we would now go to the router on the very left side of the LAB, give it a IPv6 IP on the Eth0/0 interface, configure default route towards the VRRP IP manually and that is the end like this:

[TS7_MSR1]ipv6 route-static 0::0 0 2a02:d200::5:100
[TS7_MSR1-Ethernet0/0]disp this
#
interface Ethernet0/0
 port link-mode route
 ipv6 address 2A02:D200::5:C/112
#

 Step 4 – Redistributing static to BGP

On the TS1 and TS2 routers, we are going to create a static route towards the loopback on the TS7 router.

[Ts1_5800]ipv6 route-static vpn-instance IPv6DMZ 2a02:d200::10:0 112 2a02:d200::5:C

Now static routes are not moved to BGP tables by default and we need to use a redistribution for this, which is not hard. In fact in our very simple scenario this is just these commands to achieve:

[TS2_5800]bgp 65101
[TS2_5800-bgp]ipv6-family vpn-instance IPv6DMZ
[TS2_5800-bgp-ipv6-IPv6DMZ]import-route static

Verification is via the display bgp vpnv6 commands like this

[TS2_5800]display bgp vpnv6 vpn-instance IPv6DMZ routing-table

 BGP Local router ID is 2.2.2.2
 Status codes: * - valid, ^ - VPN best, > - best, d - damped,
               h - history,  i - internal, s - suppressed, S - Stale
               Origin : i - IGP, e - EGP, ? - incomplete

 Total routes of vpn-instance IPv6DMZ: 6


 *^>  Network : 2A02:D200::10:0                          PrefixLen : 112
      NextHop : ::                                       LocPrf    :
      PrefVal : 0                                        Label     : NULL
      MED     : 0
      Path/Ogn: ?

 *  i Network : 2A02:D200::10:0                          PrefixLen : 112
      NextHop : 2A02:D200::5:A                           LocPrf    : 100
      PrefVal : 0                                        Label     : NULL
      MED     : 0
      Path/Ogn: ?

 *^>  Network : AAAA::1                                  PrefixLen : 128
      NextHop : 2A02:D200::4:1                           LocPrf    :
      PrefVal : 0                                        Label     : NULL
      MED     :
      Path/Ogn: 65100 64512 i

    i Network : AAAA::1                                  PrefixLen : 128
      NextHop : 2A02:D200::3:1                           LocPrf    : 100
      PrefVal : 0                                        Label     : NULL
      MED     :
      Path/Ogn: 65100 64512 i

 *^>  Network : AAAA::2                                  PrefixLen : 128
      NextHop : 2A02:D200::4:1                           LocPrf    :
      PrefVal : 0                                        Label     : NULL
      MED     :
      Path/Ogn: 65100 64512 i

    i Network : AAAA::2                                  PrefixLen : 128
      NextHop : 2A02:D200::3:1                           LocPrf    : 100
      PrefVal : 0                                        Label     : NULL
      MED     :
      Path/Ogn: 65100 64512 i

But more importantly, lets check this on the far end cisco box that this static route has arrived to it.

T5_CiscoL3-1#show ipv6 route 
IPv6 Routing Table - Default - 8 entries
Codes: C - Connected, L - Local, S - Static, U - Per-user Static route
       B - BGP, R - RIP, D - EIGRP, EX - EIGRP external
       ND - Neighbor Discovery
       O - OSPF Intra, OI - OSPF Inter, OE1 - OSPF ext 1, OE2 - OSPF ext 2
       ON1 - OSPF NSSA ext 1, ON2 - OSPF NSSA ext 2
C   2A02:D200::/126 [0/0]
     via FastEthernet1/0/11, directly connected
L   2A02:D200::1/128 [0/0]
     via FastEthernet1/0/11, receive
C   2A02:D200::1:0/126 [0/0]
     via FastEthernet1/0/22, directly connected
L   2A02:D200::1:1/128 [0/0]
     via FastEthernet1/0/22, receive
B   2A02:D200::10:0/112 [20/0]
     via FE80::BAAF:67FF:FE3D:9F66, FastEthernet1/0/22
LC  AAAA::1/128 [0/0]
     via Loopback0, receive
B   AAAA::2/128 [200/0]
     via 2A02:D200::2
L   FF00::/8 [0/0]
     via Null0, receive

And the very FINAL TEST, pinging the two loopbacks from the oposite sides of this lab.

  1. Cisco to H3C ping
    T5_CiscoL3-1#ping ipv6 2A02:D200::10:1 source loopback 0 
    
    Type escape sequence to abort.
    Sending 5, 100-byte ICMP Echos to 2A02:D200::10:1, timeout is 2 seconds:
    Packet sent with a source address of AAAA::1
    !!!!!
    Success rate is 100 percent (5/5), round-trip min/avg/max = 0/3/9 ms
  2. H3C to Cisco ping
    <TS7_MSR1>ping ipv6 -a 2A02:D200::10:1 AAAA::1 
      PING AAAA::1 : 56  data bytes, press CTRL_C to break
        Reply from AAAA::1 
        bytes=56 Sequence=1 hop limit=62  time = 4 ms
        Reply from AAAA::1 
        bytes=56 Sequence=2 hop limit=62  time = 2 ms
        Reply from AAAA::1 
        bytes=56 Sequence=3 hop limit=62  time = 2 ms
        Reply from AAAA::1 
        bytes=56 Sequence=4 hop limit=62  time = 3 ms
        Reply from AAAA::1 
        bytes=56 Sequence=5 hop limit=62  time = 4 ms
    
      --- AAAA::1 ping statistics ---
        5 packet(s) transmitted
        5 packet(s) received
        0.00% packet loss
        round-trip min/avg/max = 2/3/4 ms

References:

H3C/HP VRRP for IPv6

H3C/HP IPv6 configuration

OPTIONAL : IPv6 ND RA

<span lang="EN-US"># Specify the advertised address prefix as 2001::/64, its valid lifetime as 86400 seconds, and its preferred lifetime as 3600 seconds.</span>
[DeviceA-Ethernet1/1] ipv6 nd ra prefix 2001::/64 86400 3600


Tutorial for small Hadoop cloud cluster LAB using virtual machines and compiling/running first “Hello World” Map-Reduce example project

$
0
0

I had Hadoop experience now for more than a year, thanks to a great series of Cloud Computing courses on Coursera.org, now after ~6 months of running via several cloud systems, I finally have time to put down some of my more practical notes in a form of an article here. I will not go much into theory, my target here would be to help someone construct his first small Hadoop cluster at home and show some of my amateur “HelloWorld” code that will count all words in all works of W. Shakespeare using the MapReduce. This should leave with with both a small cluster and a working compilation project using Maven to expand on your own later …

What I have used for my cluster is a home PC with 32G of RAM to run everything inside using vmWare Workstation. But this guide is applicable even if you run this usingVirtualBox, physical machines, or using virtual machines on some Internet cloud (e.g. AWS/Azure). The point will simply be 4 independent OS linux boxes that are together one a shared LAN to communicate between each other.

Lab Topology

For this one there is not much to say about topology, I simplified everything on network level to a single logical segment by bridging the virtual network to my real home LAN to make my own access simple. However in any real deployment with more systems you should consider both your logical network (ergo splitting to VLANs/subnets based on function) and also your rack structure as Hadoop and other cloud systems are very much delay sensitive) and physical network.

LAB topology for Hadoop small cluster

LAB topology for Hadoop small cluster

Versions of software used

This is a combination that I found stable in the last 6 months, of course you can try the latest versions of everything, just a friendly note that with these cloud systems library and versions compatibility troubleshooting can take days (I am not kidding). So if you are new to Hadoop, rather take recommendations before getting angry on weird dependency troubles (which you will sooner or later yourself).

Step 1) Preparing the environment on Ubuntu Server 14.04

There are several per-requisites that you need to do in order to have Hadoop working correctly. In a nutshell you need to:

  1. Make the cluster nodes resolvable either via DNS or via local /etc/hosts file
  2. Create password-less SSH login between the cluster nodes
  3. Install Java
  4. Setup environmental variables for Hadoop and Java

A. Update /etc/hosts

For my Lab and the IPs shown in the LAB topology, I needed to add this to the /etc/hosts file on all cluster nodes:

@on ALL nodes add this to /etc/hosts:

#master
192.168.10.135 master
#secondary name node
192.168.10.136 secondarymaster
#slave 1
192.168.10.140 slave1
#slave 2
192.168.10.141 slave2

B. Create password-less SSH login between nodes

This is essentially about generating privat/public DSA keypair and redistribute to all nodes as trusted, you can do this with the following steps:

@on MASTER node:

# GENERATE DSA KEY-PAIR
ssh-keygen -t dsa -f ~/.ssh/id_dsa

# MAKE THE KEYPAIR TRUSTED
cat ~/.ssh/id_dsa.pub >> ~/.ssh/authorized_keys

# COPY THIS KEY TO ALL OTHER NODES:
scp -r ~/.ssh  ubuntu@secondarymaster:~/
scp -r ~/.ssh  ubuntu@slave1:~/
scp -r ~/.ssh  ubuntu@slave2:~/
scp -r ~/.ssh  ubuntu@cassandra1:~/

Test no with ssh if you can login to each server without password, for example from master node open ssh with “ssh ubuntu@slave1” to jump to slave1 console without being prompted for password, this i needed by hadoop to operate so should work!

NOTE: In production, you should always only move only the public part of the key id_dsa.pub, not the private key that should be unique for each server. Ergo the previous key generation procedure should be done on each server and then only the public keys should be exchanged between all the servers, what I am doing here is very unsecure that all servers use the same private key! If this one is compromised, all servers are compromised.

C. Install Java

We will simply install java and test we have correct version for Hadoop 2.7.1:

@on ALL nodes:

sudo add-apt-repository ppa:webupd8team/java
sudo apt-get update && sudo apt-get -y install oracle-jdk7-installer

Afterwards you should test if you have correct java version with command “java -version”  or that your path to it is “/usr/lib/jvm/java-7-oracle/bin/java -version”

D. Setup environmental variables

Add this to your ~/.bashrc file, we are preparing also here already some variables for the hadoop installation folder :

@on ALL nodes:

echo '
#HADOOP VARIABLES START
export HADOOP_PREFIX=/home/ubuntu/hadoop
export HADOOP_HOME=/home/ubuntu/hadoop
export HADOOP_CONF_DIR=${HADOOP_HOME}/etc/hadoop
export JAVA_HOME=/usr/lib/jvm/java-7-oracle
export PATH=$PATH:$HADOOP_PREFIX/bin
export PATH=$PATH:$HADOOP_PREFIX/sbin
export HADOOP_MAPRED_HOME=${HADOOP_HOME}
export HADOOP_COMMON_HOME=${HADOOP_HOME}
export HADOOP_HDFS_HOME=${HADOOP_HOME}
export YARN_HOME=${HADOOP_HOME}
export HADOOP_COMMON_LIB_NATIVE_DIR=${HADOOP_PREFIX}/lib/native
export HADOOP_OPTS="-Djava.library.path=${HADOOP_PREFIX}/lib/native"
export HADOOP_CLASSPATH=$JAVA_HOME/lib/tools.jar
#HADOOP VARIABLES END
' >> ~/.bashrc

Step 2) Downloading and extracting Hadoop 2.7.1

Simply download Hadoop 2.7.1 from repository and extract.

@on ALL nodes:

#Download
wget http://apache.mirror.gtcomm.net/hadoop/common/hadoop-2.7.1/hadoop-2.7.1.tar.gz

#Extract
tar -xzvf ./hadoop-2.7.1.tar.gz

#Rename to target directory of /home/ubuntu/hadoop
mv hadoop-2.7.1 hadoop

#Create directory for HDFS filesystem
mkdir ~/hdfstmp

Step 3) Configuring Hadoop for first run

Actually out-of-the-box Hadoop is configured for pseudo-cluster mode, which means you will be able to execute it all inside one server, but this is not why we are here and as such our target here is to configure it for a real cluster. Here are the high level steps.

@on ALL nodes:

edit $HADOOP_CONF_DIR/core-site.xml

change from:

<configuration>
</configuration>

change to:

<configuration>

<property>
<name>hadoop.tmp.dir</name>
  <value>/home/ubuntu/hdfstmp</value>
</property>

<property>
  <name>fs.default.name</name>
  <value>hdfs://master:8020</value>
</property>

<property>
    <name>fs.defaultFS</name>
    <value>hdfs://master:8020</value>
</property>

</configuration>

@on ALL nodes:

edit $HADOOP_CONF_DIR/hdfs-site.xml

change from:

<configuration>
</configuration>

change to:

<configuration>
<property>
  <name>dfs.replication</name>
  <value>2</value>
</property>

<property>
  <name>dfs.permissions</name>
  <value>false</value>
</property>

<property>
  <name>dfs.namenode.secondary.http-address</name>
  <value>secondarymaster:50090</value>
</property>

<property>
  <name>fs.default.name</name>
  <value>hdfs://master:8020</value>
</property>

<property>
  <name>dfs.data.dir</name>
  <value>/home/ubuntu/hdfstmp/dfs/name/data</value>
  <final>true</final>
</property>
<property>
  <name>dfs.name.dir</name>
  <value>/home/ubuntu/hdfstmp/dfs/name</value>
  <final>true</final>
</property>

</configuration>

@on ALL nodes:

edit (or create since missing) $HADOOP_CONF_DIR/mapred-site.xml

change to:

<configuration>
<property>
  <name>mapred.job.tracker</name>
  <value>hdfs://hadoopmaster:8021</value>
</property>
<property>
  <name>mapreduce.framework.name</name>
  <value>yarn</value>
</property>
</configuration>

@on ALL nodes:

edit $HADOOP_CONF_DIR/yarn-site.xml

change from:

<configuration>
</configuration>

# change to:

<configuration>

  <property>
    <name>yarn.resourcemanager.hostname</name>
    <value>master</value>
  </property>

  <property>
    <name>yarn.nodemanager.aux-services</name>
    <value>mapreduce_shuffle</value>
  </property>
 
  <property>
    <name>yarn.nodemanager.aux-services.mapreduce_shuffle.class</name>
    <value>org.apache.hadoop.mapred.ShuffleHandler</value>
  </property>

</configuration>

@on ALL nodes:

edit $HADOOP_CONF_DIR/hadoop-env.sh

change from:

export JAVA_HOME=${JAVA_HOME}


change to:

export JAVA_HOME=/usr/lib/jvm/java-7-oracle

@on MASTER

Remove “yarn.resourcemanager.hostname” property from yarn-site.xml ONLY ON MASTER node otherwise your master ResourceManager will listen only on localhost and other nodes will not be able to connect to it!

@on SECONDARYMASTER

Remove “dfs.namenode.secondary.http-address” from hdfs-site.xml ONLY ON SECONDARYMASTER node Remove “dfs.namenode.secondary.http-address” from hdfs-site.xml ONLY ON SECONDARYMASTER node

@on MASTER and SECONDARYMASTER

edit $HADOOP_CONF_DIR/slaves

change from:

localhost

change to:

slave1
slave2

Step 4) Format HDFS and first run of Hadoop

Since we now have Hadoop fully configured, we can format the HDFS on all nodes and try to run it from Master.

@on ALL nodes:

hadoop namenode -format

@on MASTER

First we start the HDFS filesystem cluster with:

start-dfs.sh

Here is an example how a successful start looks like:

ubuntu@master:~$ start-dfs.sh 
    Starting namenodes on [master]
    master: starting namenode, logging to /home/ubuntu/hadoop/logs/hadoop-ubuntu-namenode-master.out
    slave1: starting datanode, logging to /home/ubuntu/hadoop/logs/hadoop-ubuntu-datanode-slave1.out
    slave2: starting datanode, logging to /home/ubuntu/hadoop/logs/hadoop-ubuntu-datanode-slave2.out
    Starting secondary namenodes [secondarymaster]
    secondarymaster: starting secondarynamenode, logging to /home/ubuntu/hadoop/logs/hadoop-ubuntu-secondarynamenode-secondarymaster.out

Test if you want can be that from this point, your “hadoop fs” interaction with the HDFS filesystem is possible, so you can for example

#create directories
hadoop fs -mkdir /test_directory

#add a file to the HDFS (random)
hadoop fs -put /etc/hosts /test_directory/

#read files
hadoop fs -cat /test_directory/hosts


@on MASTER

Second we have to start the YARN scheduled (that will in background start also datanodes on slaves)

start-yarn.sh

Successful start looks like this:

ubuntu@master:~$ start-yarn.sh
    starting yarn daemons
    starting resourcemanager, logging to /home/ubuntu/hadoop/logs/yarn-ubuntu-resourcemanager-master.out
    slave1: starting nodemanager, logging to /home/ubuntu/hadoop/logs/yarn-ubuntu-nodemanager-slave1.out
    slave2: starting nodemanager, logging to /home/ubuntu/hadoop/logs/yarn-ubuntu-nodemanager-slave2.out

Step 5) Verification of start

The basic test is to check what services are running in the java with the “jps” command. This is how it should look like on each node:
@MASTER:

ubuntu@master:~$ jps
    4525 NameNode
    5048 Jps
    4791 ResourceManager

@SECONDARY MASTER

ubuntu@secondarymaster:~$ jps
    4088 SecondaryNameNode
    4140 Jps

 @SLAVE1

ubuntu@slave1:~$ jps
    3406 DataNode
    3645 Jps
    3547 NodeManager

 @SLAVE2

ubuntu@slave2:~$ jps
    3536 NodeManager
    3395 DataNode
    3634 Jps

Explanation is that ResourceManager is  YARN master component, while NodeManager is YARN components on slaves. The HDFS composes of NameNode and SecondaryNamenode, while DataNode is HDFS component on slaves. All these components have to exist (And be able to communicate with each other via LAN) for the Hadoop cluster to work.

Additional verification can be done by checking the WEB interfaces, most importantly (which you should bookmark for checking also status of applicaitons) is to open your browser and to to “https://master:8088”. This 8088 is a web interface of the YARN scheduler. Here are some example what you can see there, the most important for you is that:

  1. You are able to actually visit 8088 on master (means RsourceManager is running)
  2. Check the number of DataNodes visible to YARN (picture below), if you have this it means that the slaves have managed to register to the ResourceManager as available resources.
YARN ResourceManager WEB interface on port 8088, here it also proves that master can see two "Active Nodes"

YARN ResourceManager WEB interface on port 8088, here it also proves that master can see two “Active Nodes”

Step 6) Running your first “HelloWorld” Hadoop application

Ok, there two paths here.

  1. Use Hadoop provided Pi program example, but this might have high RAM requirements that my 2G slaves had trouble to run
  2. Use super-small Hadoop Java program that I provide step-by-step below to build your own application and run it to count all words in all the plays of W. Shakespeare.

Option #1:

There is already a pre-compiled example program to do Pi calculations (ergo extrapolating Pi number with very high amount of decimal places). You can immediately run this with the following command using pre-compiled examples JAR that came with Hadoop installation:

yarn jar /home/ubuntu/hadoop/share/hadoop/mapreduce/hadoop-mapreduce-examples-2.7.1.jar pi 10 1000000

However, for me this didn’t worked by default because Pi example asked for 8G of Ram in the YARN scheduler that my 2G slaves were not able to allocate, which resulted in the application to be “ACCEPTED”, but never scheduled for execution by YARN. To solve this, check below extra references on RAM management that you can optionally use here.

Option #2:

What I recommend is to already go for compiling your own super-small Hadoop application that I provided. You can download NetworkGeekStuff_WordCount_HelloWorld_Hadoop_Java_Program.tar.bz2 here or directly here is a list of commends to get both the program code, and also all the necessary packages to compile it:

@on MASTER:

# Get Maven compilation tools
sudo apt-get install maven

# Download Hadoop example project
wget http://networkgeekstuff.com/article_upload/maven_wordcount_example_networkgeekstuff.tar.bz2

# Extract the project and enter the main directory
tar xvf ./maven_wordcount_example_networkgeekstuff.tar.bz2
cd maven_wordcount_example_networkgeekstuff

So right now you should be inside the project directory where I provided the following files:

ubuntu@master:~/maven_wordcount_example_networkgeekstuff$ ls -l
total 32
drwxrwxr-x 2 ubuntu ubuntu 4096 Jun  2 09:53 input
-rw-r--r-- 1 ubuntu ubuntu 4030 Jun  2 09:53 pom.xml
drwxrwxr-x 3 ubuntu ubuntu 4096 Jun  2 09:53 src
-rwxr--r-- 1 ubuntu ubuntu  197 Jun  2 09:53 step0_prepare_HDFS_input
-rwxr--r-- 1 ubuntu ubuntu   87 Jun  2 09:53 step1_compile
-rwxr--r-- 1 ubuntu ubuntu  476 Jun  2 09:53 step2_execute
-rwxr--r-- 1 ubuntu ubuntu  102 Jun  2 09:53 step3_read_output
drwxrwxr-x 2 ubuntu ubuntu 4096 Jun  2 09:53 target

To make this SIMPLE FOR YOU, you can notice I have provided these 4 super small scripts:

  • step0_prepare_HDFS_input
  • step1_compile
  • step2_execute
  • step3_read_output

So you can simply start executing these one by one and you will manage to get at the end a result of counting all the works of William Shakespeare (provided as txt inside “./input” directory from the download).

But lets go via these files one by one for explanation:

@step0_prepare_HDFS_input

Simply uses HDFS manipulation commands to create input and output directories in HDFS and upload a local file with Shakespeare texts into the input folder.

#!/bin/bash

echo "putting shakespear into HDFS";
hadoop fs -mkdir /networkgeekstuff_input
hadoop fs -mkdir /networkgeekstuff_output
hadoop fs -put ./input/shakespear.txt /networkgeekstuff_input/

@step1_compile

This one is more interesting, it uses Maven framework to download all the java library dependencies (these are described in pom.xml file together with compilation parameters, names and other build details for the target JAR).

#!/bin/bash
echo "==========="
echo "Compilation"
echo "==========="
mvn clean package

The result of this simple command will be that there appears a new Java JAR file inside the “target” directory that we can later use with Hadoop, please take good look on the compilation process. To save space in this article I didn’t provide the whole output, but at the very end you should get a message like this:

ubuntu@master:~/maven_wordcount_example_networkgeekstuff$ ./step1_compile 
===========
Compilation
===========
[INFO] Scanning for projects...

<< OMITTED BY AUTHOR >>

[INFO] BUILD SUCCESS
[INFO] ------------------------------------------------------------------------
[INFO] Total time: 21.041s
[INFO] Finished at: Thu Jun 02 14:19:15 UTC 2016
[INFO] Final Memory: 26M/99M
[INFO] ------------------------------------------------------------------------

@step2_execute

Next step after we have all the Java JARs compiled is to load them to Hadoop using the YARN scheduled, in the script provided it is done with these commands:

#!/bin/bash

echo "============================================================";
echo "Executing wordcount on shakespear in /networkgeekstuff_input";
echo "and results will be in HDFS /networkgeekstuff_output";
echo "============================================================"; 
hadoop fs -rm -R -f /networkgeekstuff_output
hadoop jar ./target/hadoop_wordcount_project-0.0.1-jar-with-dependencies.jar \
com.examples.WordCount /networkgeekstuff_input /networkgeekstuff_output

NOTE: As first part I am always removing the output folder, the point is that the Java JAR is not checking if the output files already exist and if there is a collision the execution would fail, therefore ALWAYS delete all output files before attempting to re-run your programs with HDFS.

The “hadoop jar” command takes the following arguments:

  • ./target/hadoop_wordcount_project-0.0.1-jar-with-dependencies.jar   -> JAR file to run
  • com.examples.WordCount – Java Class that is to be executed by YARN scheduler on slaves
  • /networkgeekstuff_input  – This is first argument that is passed to the Java class, the Java code is processing this as folder as INPUT
  • /networkgeekstuff_output – This is second argument that is passed to the Java class, the Java code is processing any second argument as forlder for OUTPUT to store results

This is how a successful run of the Hadoop program should look like, notice that here since this is a very small program it very quickly jumped to “map 100% reduce 100%”, in larger programs you would see many many lines showing status of progress on both map and recude parts:

ubuntu@master:~/maven_wordcount_example_networkgeekstuff$ ./step2_execute 
============================================================
Executing wordcount on shakespear in /networkgeekstuff_input
and results will be in HDFS /networkgeekstuff_output
============================================================
16/06/02 14:36:26 INFO fs.TrashPolicyDefault: Namenode trash configuration: Deletion interval = 0 minutes, Emptier interval = 0 minutes.
Deleted /networkgeekstuff_output
16/06/02 14:36:32 INFO client.RMProxy: Connecting to ResourceManager at hadoopmaster/172.31.27.101:8032
16/06/02 14:36:33 WARN mapreduce.JobResourceUploader: Hadoop command-line option parsing not performed. Implement the Tool interface and execute your application with ToolRunner to remedy this.
16/06/02 14:36:34 INFO input.FileInputFormat: Total input paths to process : 1
16/06/02 14:36:34 INFO mapreduce.JobSubmitter: number of splits:1
16/06/02 14:36:34 INFO mapreduce.JobSubmitter: Submitting tokens for job: job_1464859507107_0002
16/06/02 14:36:34 INFO impl.YarnClientImpl: Submitted application application_1464859507107_0002
16/06/02 14:36:34 INFO mapreduce.Job: The url to track the job: http://hadoopmaster:8088/proxy/application_1464859507107_0002/
16/06/02 14:36:34 INFO mapreduce.Job: Running job: job_1464859507107_0002
16/06/02 14:36:43 INFO mapreduce.Job: Job job_1464859507107_0002 running in uber mode : false
16/06/02 14:36:43 INFO mapreduce.Job:  map 0% reduce 0%
16/06/02 14:36:52 INFO mapreduce.Job:  map 100% reduce 0%
16/06/02 14:37:02 INFO mapreduce.Job:  map 100% reduce 100%
16/06/02 14:37:03 INFO mapreduce.Job: Job job_1464859507107_0002 completed successfully
16/06/02 14:37:03 INFO mapreduce.Job: Counters: 49
        File System Counters
                FILE: Number of bytes read=10349090
                FILE: Number of bytes written=20928299
                FILE: Number of read operations=0
                FILE: Number of large read operations=0
                FILE: Number of write operations=0
                HDFS: Number of bytes read=5458326
                HDFS: Number of bytes written=717768
                HDFS: Number of read operations=6
                HDFS: Number of large read operations=0
                HDFS: Number of write operations=2
        Job Counters 
                Launched map tasks=1
                Launched reduce tasks=1
                Data-local map tasks=1
                Total time spent by all maps in occupied slots (ms)=6794
                Total time spent by all reduces in occupied slots (ms)=6654
                Total time spent by all map tasks (ms)=6794
                Total time spent by all reduce tasks (ms)=6654
                Total vcore-seconds taken by all map tasks=6794
                Total vcore-seconds taken by all reduce tasks=6654
                Total megabyte-seconds taken by all map tasks=6957056
                Total megabyte-seconds taken by all reduce tasks=6813696
        Map-Reduce Framework
                Map input records=124456
                Map output records=901325
                Map output bytes=8546434
                Map output materialized bytes=10349090
                Input split bytes=127
                Combine input records=0
                Combine output records=0
                Reduce input groups=67505
                Reduce shuffle bytes=10349090
                Reduce input records=901325
                Reduce output records=67505
                Spilled Records=1802650
                Shuffled Maps =1
                Failed Shuffles=0
                Merged Map outputs=1
                GC time elapsed (ms)=220
                CPU time spent (ms)=5600
                Physical memory (bytes) snapshot=327389184
                Virtual memory (bytes) snapshot=1329098752
                Total committed heap usage (bytes)=146931712
        Shuffle Errors
                BAD_ID=0
                CONNECTION=0
                IO_ERROR=0
                WRONG_LENGTH=0
                WRONG_MAP=0
                WRONG_REDUCE=0
        File Input Format Counters 
                Bytes Read=5458199
        File Output Format Counters 
                Bytes Written=717768

NOTE: you can see that you can get a WEB url in this output (in the example above it was : http://hadoopmaster:8088/proxy/application_1464859507107_0002/) to track the application progress (very useful in large computations that take many hours)

@step3_read_output

The last simple step is simple to read the results of the Hadoop code by reading all the TXT files in the OUTPUT folder.

#!/bin/bash
echo "This is result of our wordcount example";
hadoop fs -cat /networkgeekstuff_output/*

The output will be really long, because this very simple program is not removing special characters and as such the results are not very clean, I challenge you that for a homework you can work on the Java code to clear special characters from the counting and then second interesting problem to solve is sorting, which is very different in the Hadoop MapReduce logic.

Step 7) MapReduce Java code from the HelloWorld example we just run?

Now that we run this code successfully, lets have a look on it, if you open the single .java file in the src directory, it will look like this:

package com.examples;

import java.io.IOException;
import java.util.*;

import org.apache.hadoop.conf.Configuration;
import org.apache.hadoop.fs.Path;
import org.apache.hadoop.io.IntWritable;
import org.apache.hadoop.io.Text;
import org.apache.hadoop.mapreduce.Job;
import org.apache.hadoop.mapreduce.Mapper;
import org.apache.hadoop.mapreduce.Reducer;
import org.apache.hadoop.mapreduce.lib.input.FileInputFormat;
import org.apache.hadoop.mapreduce.lib.output.FileOutputFormat;


public class WordCount {
    public static class WordCountMap extends Mapper<Object, Text, Text, IntWritable> {
        @Override
                public void map(Object key, Text value, Context context) throws IOException, InterruptedException {
                        String line = value.toString();
                        StringTokenizer tokenizer = new StringTokenizer(line);
                        while (tokenizer.hasMoreTokens()) {
                                String nextToken = tokenizer.nextToken();
                                context.write(new Text(nextToken), new IntWritable(1));
                        }
                }
        }

    public static class WordCountReduce extends Reducer<Text, IntWritable, Text, IntWritable> {
                @Override
        public void reduce(Text key, Iterable<IntWritable> values, Context context) throws IOException, InterruptedException {
                        int sum = 0;
                        for (IntWritable val : values) {
                                sum += val.get();
                        }
                        context.write(key, new IntWritable(sum));
                }
        }

        public static void main(String[] args) throws Exception {

        Job job = Job.getInstance(new Configuration(), "wordcount");
        job.setOutputKeyClass(Text.class);
        job.setOutputValueClass(IntWritable.class);

        job.setMapperClass(WordCountMap.class);
        job.setReducerClass(WordCountReduce.class);

        FileInputFormat.setInputPaths(job, new Path(args[0]));
        FileOutputFormat.setOutputPath(job, new Path(args[1]));

        job.setJarByClass(WordCount.class);
                System.exit(job.waitForCompletion(true) ? 0 : 1);
        }

Now I will only tell you here that the Hadoop is using a programming methodology called MapReduce, where you first have to divide inputs based on defined key (here simply any word is a key) in the Mapping phase and then group them together while counting the number of instances of a given key during Reduce phase.

I do not want to go into explaining this in detail if you are new, and would very much like to recommend a free online course that you can take based on which I have learned how to program in Hadoop. With high recommendation visit here: https://www.coursera.org/specializations/cloud-computing

(optional) Step 8) RAM management for YARN cluster

One thing that you might have noticed here is the fact by default, the YARN is not setting much limits on the so called “containers” in which applications can run, this means that application can request 15G of RAM and YARN will accept this, but if he doesn’t find this resources available, it will block the execution and your application will be accepted by the YARN, but never scheduled. One way how to help these situations is to configure YARN to have much more real RAM expectations on small VM nodes like we used here (you remember we have here slaves with 2G RAM each).

Before showing you my solution to push RAM utilization down to 1G of RAM per slave, the underlining logic how to calculate these numbers for your cluster can be found in these two best resources:

http://hortonworks.com/blog/how-to-plan-and-configure-yarn-in-hdp-2-0/

http://www.cloudera.com/content/www/en-us/documentation/enterprise/latest/topics/cdh_ig_yarn_tuning.html

Please consider mandatory reading because you WILL have RAM related problems very soon yourself, if not with low RAM, then also alternatively if you are using slaves with more than 8G of ram, by default Hadoop will not use it so you have to do these configurations to also avoid under-utilization on large clusters.

In my own cluster, at the end I pushed the RAM use to use 512M RAM per application container, while maximim of 4096MB (because 2G RAM + 2G SWAP might be able to handle this on my slaves). Additionally you have to also consider the Java JVM machine overhead on each process, so you run all Java code with optional arguments to lower java to 450m of RAM (recommended 80% of total ram so this is my best guess from 512MB)

Here is the configuration that needs to be added to yarn-site.xml between the <configuration> tags:

<property> 
    <name>yarn.scheduler.minimum-allocation-mb</name> 
    <value>512</value>
</property>
<property> 
    <name>yarn.scheduler.maximum-allocation-mb</name> 
    <value>4096</value>
</property>
<property> 
    <name>yarn.nodemanager.resource.memory-mb</name> 
    <value>4096</value>
</property>

And here configuration for mapred-site.xml also to be added between the <configuration> tages:

<property>  
    <name>yarn.app.mapreduce.am.resource.mb</name>  
    <value>512</value>
</property>
<property> 
    <name>yarn.app.mapreduce.am.command-opts</name> 
    <value>-Xmx450m</value>
</property>
<property>
    <name>mapreduce.map.memory.mb</name>
    <value>512</value>
</property>
<property>
    <name>mapreduce.reduce.memory.mb</name>
    <value>512</value>
</property>
<property>
    <name>mapreduce.map.java.opts</name>
    <value>-Xmx450m</value>
</property>
<property>
    <name>mapreduce.reduce.java.opts</name>
    <value>-Xmx450m</value>
</property>

Summary and where to go next …

So on this point you should have your own small home Hadoop cluster and you have successfully compiled your first HelloWorld “Word Couting” application written to use the MapReduce approach to count all the words in all works of W. Shakespeare and store results in a HDFS cluster.

Your next steps from here should be to explor my example Java code of this Word Couting example (because there is bazzilion explanations on WordCouting in Hadoop on the net, I didn’t put one here) and if you want to truly understand the principles and also go further to writing more usefull applications, I cannot recommend anouth the free coursera.org Cloud Computing specialization courses (which are free) and I spent on them last year lot of time learning not only Hadoop, but also Cassandra DB, Spark, Kafka and other trendy names and how to write usefull code for them.

My next step here is that I will try to write simipar quick LAB example with expanding this LAB also with Spark (as it also uses YARN in the background) which is a representative system for stream processing. Stream processin is very interesting alternative to MapReduce approach that has its own set of problems where it can be more usefull than basic MapReduce.

Final NOTE: Hadoop and the whole ecosystem is very much a live project that is constantly changing, for example before using Hadoop 2.7.1  I have literally spent hours and hours troubleshooting other versions until I find out that they are not compatible with some libraries on ubuntu 14.04, or for example spent another hours when integrating Cassandra DB and Java API for cassandra (called Datalex) until I realized that these simply cannot be compinded inside one server as each demands different Java and some libraries, as such my warning when going into OpenSource BigData is that you will definitelly get tired/angry/mad until you have a working cluster if you run into a wrong combination of versions. Just be ready for it and accept it as a fact.

HPE’s DCN / Nuage SDN – Part 1 – Introduction and LAB Installation Tutorial

$
0
0

Nuage Networks is a spinoff from Alcatel-Lucent (now under Nokia as they acquisition Alcatel recently) and also a name of software defined network (SDN) overlay solution for datacenters and direct competitor for a bit more widely known vmWare’s NSX. However Alcatel/Nokia are not the only backers here, Hewlett Packard Enterprise (HPE) also got a vested interest in this technology and jumped on the partnership with Alcatel/Nokia generating their own spin-off called “HPE’s Distributed Cloud Networking” or HPE DCN for short. In this article I am going to quickly summarize what it should be capable of doing, and then I am going do a run down of how to install this system in a home lab environment, while trying to minimize the requirements for a home install of this beast sacrificing a few redundancies that you would normally have in a DC setup.

I am marking this article as “Part 1” because this installation will only provide the most very basic overlay solution and there will be follow-ups that will go into different aspects later (e.g. redundancy, cooperation with vmWare ESX high availability or L3 VTEPs). For now we are going to setup a simple lab, trying to minimize the requirements for the HW.

In subsequent Parts 2/3/etc… we are going to be focusing on suing the HPE DCN to create virtual networks, create best redundancy resilience for individual components and get through some interesting use-cases.

Index of article series:

Introduction to SDN Overlays

I have already written some SDN articles here on networkgeekstuff.com, but those where more oriented in controlling the real forwarding fabric with SDN, here with Nuage inside DCs, the SDN is actually trying to solve something completely different. Lets start with a problem declaration:

Problem Declaration: I have a DC where I host multiple customers, all having their physical/virtual and other appliances randomly placed inside my underlay (this is a term I am going to use for the internal routing of the DC, not for customers routing). What mechanisms should I choose to separate my customers inside my DC ? Below is a picture of this problem:

Leveraged DC physical structer and the problem declaration of multiple customers inside.

Leveraged DC physical structer and the problem declaration of multiple customers inside.

Now if you are a networking guy reading this, your first idea will probably be: “This is easy! This is what we do all the times with VLANs and VRFs!” and you will be partially right. However your are right only as in 1998 people where right that Internet search will be solved by manual indexing before google came and turned everything upside down … we are maybe at that time in networking. In summary, the problem with your solution is that it is manual work configuring every customer box-by-box using VLANs and VRFs.

In contrast, SDN solution like Nuage is trying to solve this problem by deploying a layer of network abstraction/virtualization and keeping the customer networks hidden from the normal traditional network underlay. Because my dear network enthusiast reader, the biggest problem today is simply YOU! Manual work, your salary and the fact that in every project where network is involved, someone has to design a new network always from scratch and manually configure large amount of vendor specific boxes to work as intended … this is why today network is usually the slowest part of any infrastructure project.

Solving leveraged DC problem traditionally vs. with SDN Overlay, which one do you believe is more simple in larger scales and hundreds of customers?

Solving leveraged DC problem traditionally vs. with SDN Overlay, which one do you believe is more simple in larger scales and hundreds of customers?

So in this tutorial, we are doing to create a quick lab, trying to get the SDN Overlay solution working using the Nuage system.

LAB/HW requirements to follow this tutorial

For this first tutorial (part 1), I will minimize the amount of HW needed and we will not install a few redundant systems to lower the amount of RAM needed. In later follow-up tutorials we will fix this, but for right now we will small.

Knowledge pre-requisites:

This tutorial starts by showing you a vmWare based LAB topology on which you we will be installing the Nuage, we will not show you step by step how to work with vmWare systems here and it is assumed you know this (honestly even if you do not, this is something that you can find elsewhere on the web)

  • Ability to install & configure vmWare Workstation 12
  • Ability to install & configure vmWare ESXi host hypervisor to a vmWare Workstation virtual host
  • Ability to install & configure vmWare vCenter (at least as OVA appliance deployed and you add control over the ESXi hosts to it)
  • Basic linux skills (needed to deploy the NFS  / DNS and othter basic tools needed)

HW that I have used:

  • 64GB or RAM PC with 4core processor supporting VR/AMD-X and nested paging (because we will be using virtualization inside virtualization here)
  • NFS server, I have used my home NAS linux simply running NFS-kernel and NFS-common packages
  • DNS server that supports also reverse DNS and SRV records declaration, I have used bind9 running at my home
  • NTP server or internet access to connect to a public one

SW that I have used:

  • vmWare Workstation Pro 12 (you can try VirtualBox but I am 99% sure you will run into problems having ESX hosts inside VirtualBox later)
  • ESXi 6.0 (I do not have access to 6.1 yet), evaluation / trial license is enough
  • vCenter appliance OVA to control my ESXi virtual hosts, evaluation / trial license is enough

HPE DCN software packages needed:

HPE DCN is a platform with three basic components (there are more, but that is for follow-up tutorials) called Virtual Services Directory (VSD), Virtual Services Controller (VSC) and Virtual Routing Switch (VRS), below is a quick picture how they are orchestrating with VSD and VSC forming a control plane and VRS integrated as work horse into every hypervisor or server installed.

HP DCN / Nuage topology

HP DCN / Nuage software packages topology

In our tutorial, you will need these three packages (I used version 4.03r of HP DCN, Nuage from Alcatel has different versioning):

  • VSD as installation ISO (there exists OVA or installation ISO, I will be using the ISO here, but feel free to use OVA to make it more simple for LAB only, in production always use ISO install)
  • VSC as OVA package
  • VRS as OVA package

LAB topology

The lab topology is simple in this first toturial to demonstrate the complex overlay over simple underlay. Topology diagram is visible below. The background is simply that  I have installed vmWare Workstation 12 on my primary PC (the one with 64G of RAM) and created four virtual machines, each with 16G of RAM and 100G of HDD.  On these four virtual machines, I have installed ESXi hypervisors and given them bridged access to my lab network.

Nuage LAB topology - minimal using single physical PC with vmWare Workstation simulating 4x ESXi hosts and interconnected by a simple switched network.

Nuage LAB topology – minimal using single physical PC with vmWare Workstation simulating 4x ESXi hosts and interconnected by a simple switched network.

My logic here is that ESX1 – 192.168.10.132 will be my management systems host for vCenter / VSD / VSC and the remaining ESX2 – 192.168.10.133 will be non-redundant ESX host and ESX3 – 192.168.10.135 and ESX4 – 192.168.10.136 will be my redundant ESXi cluster hosts.

After I have deployed all four ESXi hosts and the vCenter on ESX1, the starting point view on vCenter GUI should be something like this:

vCenter view on LAB topology before Nuage installation

vCenter view on LAB topology before Nuage installation

LAB DNS, NFS and NTP

Before we jump into installation of Nuage, you need to have the lab setup with DNS, NTP and NFS.

DNS configuration

DNS is needed for nuage to operate as all the main nodes are finding each other using it, this means that you have to have a LAB DNS deployed, in my environment I simply deployed bind9 DNS server on my linux NAS server. Each planned system  (both physical and virtual) got a DNS hostname assigned, and I have created a domain “homelab.networkgeekstuff.com”. To save time / space, below are links to my bind9 configuration files, if you have a different DNS system, this is what you need to setup to follow this tutorial:

#HOSTNAME       R.TYPE  IP
vcentersso      A       192.168.10.134

vsd1            A       192.168.10.137
xmpp            A       192.168.10.137
_xmpp-client._tcp.xmpp.homelab.networkgeekstuff.com. SRV 10 0 5222 vsd1.homelab.networkgeekstuff.com.

vsc1man         A       192.168.10.140
vsc1            A       192.168.10.141

vrs1            A       192.168.10.150
vrs2            A       192.168.10.152
vrs3            A       192.168.10.154

You can see above that we need a DNS entry for vcenter, VSD called vsd1 (inclluding allias for XMPP client and SRV record for XMPP), VSC called vsc1 and one extra for its management as vsc1-man and a group of three VRS systems vrs1, vsr2 and vrs3. In bind9 the above I configured inside file db.homelab.networkgeekstuff.com that needs to be placed in /etc/bind directory.

Secondly, your DNS has to support rDNS so that reverse lookups of IP will resolve the hostname of that system, in bind9 this is done by creating db.192 file also inside /etc/bind directory, this file inclues a reverse lookup rules for all the IPs inside local subnet 192.168.10.128/64 that I am using.

The last configuration file  is named.conf.local which already exists in your bind install, but you have to update it to point to the two new files I mentioned above.

Hint: If you are configuring bind9 for the first time, do not forget to also edit /etc/bind/named.conf.options and add to “forwarders {};” your normal ISP DNS servers where bind should forward your DNS queries if it doesn’t have them locally inside your local database.

NTP configuration

I simply used internet NTP server randomly from the linux NTP client package, simply take one that you are maybe already using or if your not using anything, write down for the moment this IP 193.171.23.163 that I have used, we will need to use this durin VSD and VSC installation.

NFS configuration

In this tutorial, I am going to show how nuage is installed for a stand alone ESXi host and also a cluster of ESXi hosts for creating a baseline for having a real high availability (HA) for our simulated customers VMs. For vCenter to create a cluster of ESXi you need a shared storage for this cluster to use which is outside of the cluster, for this reason I have used a simple NFS storage that you can get from any linux host (including a VM running inside some other ESX or your vmWare Workstation in worst case) with the following example commands:

#1 - install 

apt-get install nfs-kernel-server nfs-common

#2 - create exports

mkdir /home/<your user>/NFS
mkdir /home/<your user>/NFS/datastore1
mkdir /home/<your user>/NFS/datastore2
chown -R nobody:nogroup /home/<your user>/NFS
chmod -R 755 /home/<your user>/NFS

#3 edit /etc/exports and ad there these two lines:

/home/<your user>/NFS/datastore1   *(rw,insecure,all_squash,no_subtree_check)
/home/<your user>/NFS/datastore2   *(rw,insecure,all_squash,no_subtree_check)

#4 restart the nfs-kernel-server

service rpcbind start
service nfs-common restart
service nfs-kernel-server restart
exportfs -ra

Step 1. Installing VSD (stand-alone)

For VSD that I will from this point call it VSD1 because of it’s DNS hostname, in this tutorial we will go for a stand-alone installation type (part 2 of this tutorial in the future will show how to deploy this in 3+1 HA cluster mode). As VSD1 server, I have deployed a 16G RAM virtual machine (note that by requirements the VSD in production should have a minimum of 24G of RAM, but 16G is more than enough for lab use) in my management ESX1 host.

a) Install CentOS 6.7 as base OS for VSD1

My Nuage version 4.03r said that CentOS 6.5+ is supported, but please note that CentOS 6.8 is actually not yet compatible with the VSD installation, so you have to use CentOS 6.7 to have a success here (and I learned this the hard way).

b) Make sure NTP is synchronized

VSD installation and running requires that the base OS clock is synchronized with NTP, if you do not have it running or installed, install NTP package using “yum install ntp” and run it using “service ntp start” to get it synchronized. Then check with “ntpstat” if it is synchronized, success looks like this

[root@vsd1 ~]# ntpstat 
synchronised to NTP server (193.171.23.163) at stratum 2 
   time correct to within 33 ms
   polling server every 256 s

c) Run installation from ISO on VSD1

Grab the VSD ISO installation package ( in my case DCN-VSD-ISO-4.0R3.zip), unpack it and either connect it as CDROM to the VM or simply upload all the contents of the ISO as files to the VSD1 VM. Since I mounted the iso as virtual CDROM to the VM, i accessed the ISO as follows:

[root@vsd1 ~]# mount /dev/scd0 /media/CDROM/
mount: block device /dev/sr0 is write-protected, mounting read-only
[root@vsd1 ~]# cd /media/CDROM/
[root@vsd1 CDROM]#

And from this you can start the installation script with “./install.sh” and answer all the questions of the wizard driving towards a stand alone installation as on the example below:

[root@vsd1 CDROM]# ./install.sh 
-------------------------------------------------------------
  V I R T U A L I Z E D  S E R V I C E S  D I R E C T O R Y  
  version 4.0.3_26
-------------------------------------------------------------
VSD supports two configurations:
1)  HA, consisting of 3 redundant installs of VSD.
2)  Standalone, where all services are installed on a single machine.
Is this a redundant (r) or standalone (s) installation [r|s]? (default=s): s
Deploy VSD on single host vsd1.homelab.networkgeekstuff.com  ...
VSD node:      vsd1.homelab.networkgeekstuff.com
Continue [y|n]? (default=y): y
Starting VSD deployment. This may take as long as 20 minutes in some situations ...
VSD package deployment and configuration DONE. Please initialize VSD.
DONE: VSD deployed.
Starting VSD initialization. This may take as long as 20 minutes in some situations ...
<omitted>

After a few more lines you should see a success message that the VSD is installed successfully and it will also by default start running.

d) Verify that VSD is running and stop/start

The VSD start/stop and status is controlled by a monitoring daemon behind a “monit” command. The three main commands to check status are:

[root@vsd1 ~]# monit summary
The Monit daemon 5.17.1 uptime: 4h 12m 

Process 'zookeeper'                 Running
Program 'zookeeper-status'          Status ok
Program 'vsd-core-status'           Status ok
Program 'vsd-common-status'         Status ok
Program 'ntp-status'                Status ok
Process 'mysql'                     Running
Program 'mysql-status'              Status ok
Process 'mediator'                  Running
Program 'mediator-status'           Status ok
File 'jboss-console-log'            Accessible
File 'monit-log'                    Accessible
File 'mediator-out'                 Accessible
File 'zookeeper-out'                Accessible
Program 'keyserver-status'          Status ok
Process 'jboss'                     Running
Program 'jboss-status'              Status ok
Program 'ejbca-status'              Status ok
Process 'ejabberd'                  Running
Program 'ejabberd-status'           Status ok
System 'vsd1.homelab.networkgeekstuff.com' Running
[root@vsd1 ~]# monit -g vsd-core summary
The Monit daemon 5.17.1 uptime: 4h 12m 

Program 'vsd-core-status'           Status ok
Process 'mediator'                  Running
Program 'mediator-status'           Status ok
Program 'keyserver-status'          Status ok
Process 'jboss'                     Running
Program 'jboss-status'              Status ok
Program 'ejbca-status'              Status ok
[root@vsd1 ~]# monit -g vsd-common summary
The Monit daemon 5.17.1 uptime: 4h 12m 

Process 'zookeeper'                 Running
Program 'zookeeper-status'          Status ok
Program 'vsd-common-status'         Status ok
Process 'mysql'                     Running
Program 'mysql-status'              Status ok
Process 'ejabberd'                  Running
Program 'ejabberd-status'           Status ok

Additionally, you should now be able to login to VSD using web interface (default login csproot/csproot and organization “csp”) in port 8443, for my case this was https://vsd1.homelab.networkgeekstuff.com:8443

VSD first login to web interface on port 8443

VSD first login to web interface on port 8443

If you ever need to shutdown the VSD, you can use:

monit -g vsd-core stop
monit -g vsd-common stop

and monitor the status until everything is stopped, similarly, to start the vsd again you can use

monit -g vsd-common start
# wait until all in common is tarted before starting core part!
monit -g vsd-core start

Great, if you are here, you have your VSD1 installed successfully and we can proceed to installing VSC now.

Step 2. Installing VSC (stand-alone)

VSC installation itself is very simple because for vmWare it is integrated in template customization when deploying OVF template, the interesting part comes when configuring it because VSC is technically an Alcatel Lucent router system with a very specific command prompt. But without more delay, here is the process:

a) Deploy OVF template of VSC to ESX1 host

Starting deployment of VSC ova in vCenter

Starting deployment of VSC ova in vCenter

Follow the typical OVF deployment process, Just note that ths VSC has two network interfaces, one is managment and one is data (production) network, since we are only using one network here, give the VM access to the lab network on both interfaces. If you look back above to my lab topology, you will notice that I have provided IP addresses to both interfaces from the same subnet. In production environment, these two interfaces should go to different networks, one for managment and one for data traffic underlay.

VSC two interfaces, but for our lab configured to access the same network

VSC two interfaces, but for our lab configured to access the same network

On one point the OVF deployment process comes to VM template customization and will ask you several parameters to be filled manually. We have to give the VSC its IPs on both intefaces, DNS server IPs, default gateway and most of the parameters are self-explanatory and below is my configuration for my lab:

VSC template customization via vmWare

VSC template customization via vmWare

Hint: In the above configuration, the XMPP server should be pointing to vsd1, not to the xmpp DNS record that we have cerated for stand-alone VSD installations, if you configure this to the XMPP (thinking that the DNS is pointing to the same IP! you are going to get a XMPP negotiation problems because the VSC is going to contact “xmpp”, while response ID will be from vsd1 as source inside the XMPP protocol).  We will be re-configuring this only later in cluster VSD deployments.

b) login into the VSC and configure XMPP

Now after the VSC is deloyed, you can start it and after a while you will be able to login to it using SSH and default credentials “admin/Alcateldc”. The next thing that we need working is XMPP connection to vsd1, this can be checked with “show vswitch-controller vsd” command and by default, there will be nothing and we have to fix a small parameter syntax to make it working as shown below the whole process:

*A:vsc1# show vswitch-controller vsd                                      

===============================================================================
Virtual Services Directory Table
===============================================================================
User Name                       Uptime             Status
-------------------------------------------------------------------------------
No Matching Entries
===============================================================================

*A:vsc1# config vswitch-controller
*A:vsc1>config>vswitch-controller# info 
----------------------------------------------
        xmpp-server "vsc1@vsd1.homelab.networkgeekstuff.com"
        open-flow
        exit
        xmpp
        exit
        ovsdb
        exit
----------------------------------------------

* indicates that the corresponding row element may have been truncated.
*A:vsc1>config>vswitch-controller# shutdown 
*A:vsc1>config>vswitch-controller# xmpp-server "NSC-vPE1:password@vsd1.homelab.networkgeekstuff.com"
*A:vsc1>config>vswitch-controller# no shutdown 
*A:vsc1>config>vswitch-controller# show vswitch-controller vsd 

===============================================================================
Virtual Services Directory Table
===============================================================================
User Name                       Uptime             Status
-------------------------------------------------------------------------------
cna@vsd1.homelab.networkgeekst* 0d 00:02:38        available
-------------------------------------------------------------------------------
No. of VSD's: 1
===============================================================================
* indicates that the corresponding row element may have been truncate

The problem that we fixed above was that the OVF deployment template didn’t followed a correct syntax and we needed to add a default password “password” to the configuration and I have optionally changed the name to NSC-vPE1.  Afterwards the show vswitch-controller vsd command showed an active connection to the VSD.

c) Verify VSC visible from VSD

This check is actually simple, login to the VSD web gui (check above VSD installation steps to know how) and open the monitoring tab, then click VSP and you should see your VSC box registered there (green color means alive, red -> unreachable).

Checking VSC registration to VSD via the VSD view

Checking VSC registration to VSD via the VSD view

Step 3. Installing VRS to standalone ESXi host

In this step, we are going to install the last component called VRS (virtual router-switch) to a stand alone ESXi host. If you have an ESXi cluster, the process is very similar and I recommend you read the guide for a single ESXi host first, and then I created below optional “Step 4” for ESXi hosts that only shows the differences (for time / space reasons), but has some specialties that I wanted to mention separately.

Principle of VRS orchestration

The VRS is practically a virtual machine (VM) running on the ESXi host similarly like all other VMs, the difference is that it is trying to be also a network appliance and as such demands to be orchestrated inside the ESXi host using a specific setup of VMwares internal vSwitches and distributed vSwitches. To ilustrate this, have a look at the configuration that I will be creating in this part of the tutorial:

Orchestration of ESXi host internal VMware switches and VRS installed as VM

Orchestration of ESXi host internal VMware switches and VRS installed as VM

On the diagram above, you can see that a single ESXi host (red border) in my lab will use a sequence of both VMware’s dSwitch (called “dvSwitch-nuage-1-192.168.10.133”), Nuage VRS (called “VRS1”) and older VMware’s “vSphere vSwitch” (called “vSwitch0”).  The purpose of individual components is as follows:

  • VMware dSwitch – “dvSwitch-nuage-1-192.168.10.133”:  This is the switch used to aggregate traffic from all the end user virtual machines (VMs) and push it to VRS for processing. It has two main port groups, one is called VMPG that is for communication with the virtual machines and one called OVSPG that is a promiscuous port configured to allow all traffic of the VMs to be visible to the VRS.
  • VRS1 – The VRS itself running as just another VM on the ESXi host (we will be deploying this simple with OVF template deployment later), the purpose of this box is to capture all other VM traffic and process it as instructed by the VSD/VSC. It should communicate with VSD/VSC via “Management interface” and with other VRSs and VRS-Gs via “data network”. Note that in our lab for simplicity we have management and data network merged behind one and the same “vSwitch0” which should definitely NOT be the case if you are building a production.
  • vSwitch0 (as access to “Lab management” and “Data Network”), in our LAB deployment, we will be simply connecting the management and data network interface of VRS to the same vSwitch0, this will give our VRS access to the lab simple network and it will work correctly, however for any production deployment it is very much recommended to create one extra distributed vSwitch or vSphere vSwitch (ergo here it would be vSwitch1) that would separate managment network (communication with VSC/VSDs) and data network (forwarding traffic between all the VRSs and VRS-Gs).

1. Preparing the ESXi host networking

We are starting here with a freshly installed ESXi host, that by default has one standard “vswitch0” and both management and physical interfaces connected to it as visible in the picture below taken from vCenter’s view on this ESXi host:

ESXi host starting point with default vswitch0 connected to all physical adapters

ESXi host starting point with default vswitch0 connected to all physical adapters

1.1 Deploy VMware distributed switch

What we need to do is to deploy a VMware distributed switch with a special configuration before installing VRS. We can deploy this by clicking Networking -> homelab (or name of your DC) -> Distributed Switch -> “New Dsitributed Switch…” like on the picture below:

Deploying new Distributed Switch to ESXi host

Deploying new Distributed Switch to ESXi host

Configuration of the new dSwitch:

  • Name: In the wizard, I am going to name this switch as “dvswitch-nuage-192.168.10.133-host” because this distributed switch will be exclusively deployed to this single ESXi host later.
  • Version: Simply latest, I am using 6.0.
  • Uplinks: We do not need any uplinks for this switch because it is going to be used between customer VMs and VRS only, but VMware wants us to declare a minimum of 1 uplink, so lower the uplinks number to minimum which is 1
  • Default port group: Create one default port group that is ending with “-PG1” in name, for example I have created “192.168.10.133-PG1”.

Here is a summary picture from my deployment:

dvSwitch deployment configuration summary

dvSwitch deployment configuration summary

1.2. Add extra port groups to dSwitch

In addition to the default “-PG1” port group, our dSwitch needs two more port groups with special configurations. So via the Networking menu, open “New Distributed Port Group..” wizard as shown below:

"New Distributed Port Group.." wizard location

“New Distributed Port Group..” wizard location

Create the following port-groups with the following configuration:

  • <your-ESXi-host>-OVSPG
    VRS will be looking for one port group with name ending as “-OVSPG” so for example I have created for myself a port group called “192.168.10.133-OVSPG”.Configuration
    • Advanced: Make “Block ports” / “Vendor configuration” / “VLAN” allowed
    • Security:  Change to “Accept” all three items -> “Promiscuous mode” / “MAC address changes” / “Forged transmits”
    • VLAN: Change to VLAN type – “VLAN trunking” and trunk range “0-4094”
    • Uplinks: Do not add any uplinks (Default)
  • <your-ESXi-host>-VMPG
    VRS will be looking for one port group with name ending as “-VMPG” so for example I have created for myself a port group called “192.168.10.133-VMPG”.Configuration
    • Advanced: Leave defaults
    • Security:  Leave defaults (ergo in 6.0 all items are “Reject” state)
    • VLAN: Change to VLAN type – “VLAN” and select a VLAN number of your choice, if you have no specific VLAN logic, simply select “2”
    • Uplinks: Do not add any uplinks (Default)

After your configuration of all port-groups, the final view on this dSwitch should be similar to this:

Final view on dSwitch port groups

Final view on dSwitch port groups

1.3 deploy dvSwitch to ESXi host

Yes, the dSwitch you created is not yet deployed on the specific ESXi host we are targeting, therefore simply add your host to the dSwitch via “Add and Manage Hosts..” wizard found in Networking area of vCenter. Note: Simply deploy the dvSwitch and do not migrate to it anything! Do not move VMkednel or physical adapters like the wizard would like to do by default.

Add and Manage Hosts ... wizard in vCenter

Add and Manage Hosts … wizard in vCenter

To check if your deployment was successfull, you have to go back to Hosts view and check the Manage->Networking view if both vSwitch0 and the new distributed vSwitch are present on the host like below:

new dvSwitch and the old vSwitch0 both deployed on the ESXi host 192.168.10.133

new dvSwitch and the old vSwitch0 both deployed on the ESXi host 192.168.10.133

2. Deploying VRS image to the ESXi host

Now finally we will get to the VRS deployment itself. Fortunatelly for you, this is actually a very quick step as VRS on vmWare is using a customized OVF deployment with all the configration parameters of VRS you can enter using vCenter GUI before the VRS VM is started for the first time.

You start by simply opening “Deploy OVF Template..” wizare in your vCenter (righ click on the ESXi Host) and navigate to the VRS.ovf files that you should have access to.

Deploy OVF Template wizard location

Deploy OVF Template wizard location


18_VRS_loaded

VRS image OVF file load to vCenter

Hit “next” and the vCenter will start loading the OVF file. I am going to skipp the vCenter VM configuration here because you should simply continue as with any other VM, that is select a storage datastore in the local ESXi cluster, this VM is bound to the ESXi host so you should not think about this VM redundancy as outside of this ESXi host it is useless anyway.

The first important configuration is “Setup Networks” where we have to stop and select correct interface connection. Configure your VRS VM network interfaces as follows:

  • VM Network” – This is this VMs management interface, in our lab as shown above, we will simply use our “vSwitch0” connection with by default has a port-group called “VM Network” (note: This is a bit confusing as the VRS interface and the default vSwitch0 portgroup has the same name, but usually this can be any portgroup / vSwitch or dSwitch that leads to managment network, the name “VM Network” is not demanding connection to this default port range).
  • 1-mvdce2esim04-OVSPG” – This is the VRS communication channel (the promisous one if you remember the port-group configuration) to all the distributed dvSwitch, configure this to connect to the “<your-host>-OVSPG” interface, in my case the “192.168.10.133-OVSPG”.
  • mvdce2esim04-Datapath” – this is connection/interface to the “Data network”, which if you remember in my lab is the same as management network, so in my lab I am also going to confige this tot he default vSwitch0 portgroup called “VM Network” that will lead to my LAB central subnet.
  • Multicast Source” – this is the interface via which VRS can provide support for Multicast traffic in the Overlay / Virtual SDN networks, but this is out of scope of this tutorial and also basic use cases. The only note that I leave you with is that this can be yet another vSwitch or dvSwitch that can lead to a dedicated interface used for multicast traffic.

Here is how I have configured my VRS at the end with interfaces, since my LAB merged data network , managemnt network and possibly in the future multicast network behind the default vSwitch0, it looks quite boring.

VRS deployment network interfaces (LAB only with data + management + multicast using default vSwitch0)

VRS deployment network interfaces (LAB only with data + management + multicast using default vSwitch0)

The second important configuration page in the OVF deployment is called “Customize template”, there are roughly 13 fields that are mandatory to be filled, most of them are self-explanatory and there is detailed explanation in the Nuage installation guide, for making this quick for our LAB, I am going to show you how I configured my VRS and the most important thing are :

  • Management IP / netmask /gateway / DNS
  • Data IP /netmask /gateway / DNS
  • Hypervisor IP + username/password (this is important as VRS agent needs to read hypervisor API information)
  • vCenter IP + username/password (as above, VRS agent needs to read vCenter API information)
  • Controller (VSC) IPs, it wants primary and backup controller, we unfortunatelly have only one, so I used our VSC1 controller IP : 192.168.10.141 and then as backup used a non-existing 192.168.10.143. In next parts of this guide we will use this when we will be deploying VSC redundancy.
  • NTP: Used the internet IP 193.171.23.163

Here are screenshots how it looks in the OVF deployment:

VRS parameters in OVF deployment #1

VRS parameters in OVF deployment #1

VRS parameters in OVF deployment #2

VRS parameters in OVF deployment #2

Once deployment is done, simply start the VM.

3. checking VRS install

Now we have VSD, VSC and VRS all running, it is time to check if they all see each other.

First, let look via VSC because this one has a session with both VSD and VRS (you should remember that for VSC you can access it via SSH with admin/admin credentials). Once inside VSC, us the show vswitch-controller vswitches command to show all VRSs that registered to this VSC successfully.

*A:NSC-vPE-1# show vswitch-controller vswitches 

===============================================================================
VSwitch Table
===============================================================================
vswitch-instance               Personality Uptime       Num VM/Host/Bridge/Cont
-------------------------------------------------------------------------------
va-192.168.10.150/1            VRS         0d 00:24:16  0/0/0/0
-------------------------------------------------------------------------------
No. of virtual switches: 1
===============================================================================

The second option is more simple, you can simply view all components via VSDs monitoring tab.

VSD's view on VSC and VRS in a chain, and all "green" as up and reachable

VSD’s view on VSC and VRS in a chain, and all “green” as up and reachable

Step 3.b (optional) Installing VRS on ESXi cluster

Lets start by principle explanation, VMware clusters exist to provide redundancy and distributed resource allocations to VMs, in my lab, I have installed a small cluster using two ESXi hosts, one is 192.168.10.135 and second 192.168.10.136 and I have added them to a cluster called “Production Cluster 1” as visible on picture below from vCenter:

vCenter view on simple cluster in inventory

vCenter view on simple cluster in inventory

Now in regards to VRS deployment, the principle is that each ESXi host inside a cluster should get its own VRS. This helps give the cluster an overall performance as having single VRS per cluster is also possible (think about the dvSwitch configuration), but there is no real reason to do it like that. Each VRS should be deployed as a VM to each specific ESXi host with VMware’s HA (high availability) disabled for that VM because there is no point of moving VRS to another ESXi host on failure as that would create two VRS VMs on single ESXi and would lead to collision.

Below is a high level view on how to install two VRSs on a cluster of two ESXi hosts that I deployed in my lab.

Two VRS orchestration on cluster of two ESXi hosts

Two VRS orchestration on cluster of two ESXi hosts

The important part to take from the above picture is that the dvSwitch component and vSwitch0 components are deployed identically as with a single ESXi host and as such there is no difference in the installation process, you should simply again define a dvSwitch with -OVSPG and -VMPG port groups like shown in this tutorial for a single ESXi host, but then deploy this dvSwitch on both members of this cluster and install two VRSs to each member following the OVF template deployment.

Afterwards, your vCenter view should look like this:

Two VRSs in cluster

Two VRSs in cluster (note that each VRS VM is assigned to each ESXi host in background)

While in your VSC console, you should be able to display all three VRSs now (two on cluster and one from the previous install on single ESXi):

*A:NSC-vPE-1# show vswitch-controller vswitches 

===============================================================================
VSwitch Table
===============================================================================
vswitch-instance               Personality Uptime       Num VM/Host/Bridge/Cont
-------------------------------------------------------------------------------
va-192.168.10.150/1            VRS         0d 02:03:25  0/0/0/0
va-192.168.10.152/1            VRS         0d 00:28:41  0/0/0/0
va-192.168.10.154/1            VRS         0d 00:23:40  0/0/0/0
-------------------------------------------------------------------------------
No. of virtual switches: 3
===============================================================================

And also in your VSD it should see all three VRSs registered

VSD's view on all VRSs

VSD’s view on all VRSs, and the last two 192.168.10.152 and 192.168.10.154 are the cluster VRSs

Summary

This guide showed you how to install basic HP DCN / Nuage system and you should now play on your own in the VSD gui to create some virtual networks yourself.

References

Teaser for the next parts of this tutorial

If you do not want to decode user guide on what to do next here, youu can wait for the “upcomming” part 2 of this tutorial we will go over basic steps how to design and create a virtual network for our customer and deploy some customer VMs that the VRS/VSC will auto-detect. And in pert 3 later, we will be upgrading all components to make them redundant, ergo making a VSC cluster and also installing the VSD as a cluster of three boxes. Stay tuned!

Index of article series:

HPE’s DCN / Nuage SDN – Part 2 – First Steps Creating Virtual/Overlay Customer Network

$
0
0

In the previous part 1, we have installed basic HPE DCN system on a group of ESXi hosts. But we didn’t actually done anything inside it, so lets fix this by creating a first “HelloWorld” customer that we will call “NetworkGeekStuff” and deploy some virtual machines to this virtual network. In this part we are going to fix that and we will create a very basic virtual customer, a username/password for that customers administrator and create a small 3 tier ( database / internal  / dmz) network using HPE DCN’s overlay virtual network. And at the very end, we are going to connect to this network a few virtual machines.

Index of article series:

Starting LAB state

We will start exactly where we ended on previous part 1, but to double-check, I am going to show the main views of my vCenter and VSD environment to show how “empty” it is after a pure install that we did so far. So starting with this, below is my view on vCenter boxes, with one management ESXi host (192.168.10.132), one single ESXi host (192.168.10.133) with VRS installed and an ESXi cluster (192.168.10.135/192.168.10.136) with a dual VRS installation from last lab.

vCenter view starting this LAB

vCenter view starting this LAB

VSD view on installed components (logged in as csproot and access via "Monitoring" tab)

VSD view on installed components (logged in as csproot and access via “Monitoring” tab)

Step 1. Creating VSD company

So first step is simple (at least for now as we will not go in this tutorial into company templates and use dafult template), when you first login to VSD as csproot, you see an empty screen because there are no companies and there is a big plus “+” sign in the white space, when you click this you can create a new company. In HPE DCN’s terminology a company is called “Enterprise” so from this point I will use this name. So lets look at the picture below, where I have simply created a “NetworkGeekStuff” enterprise, with default profile and I selected a private AS number 65512 (as private AS numbers are 65512-65535), but you can also leave this blank, this will be used later in future tutorials for BGP peering with WAN.

New customer creation

New customer creation

Next time when you enter VSDs default view, you can select this enterprise from the list on the left side.

Step 2. Creating users / group permissions

In our installation and to create a new Enterpise we used the default super-admin called “csproot”, but for Enterprises it is very usefull to create at least two users, one will be an admin for a specific Enterprise, and the second one would be a passive read-only users, but he will be an owner of all the virtual machines later. In our example here, we will create two users:

  1. petern – this will be my admin user for the enterprise network design
  2. appuser – this will be a read only
Creating first user for admin (permissions added later) in VSD

Creating first user for admin (permissions added later) in VSD

Adding a second "appeser" in VSD

Adding a second “appeser” in VSD

Next step is to put these two users into their groups to give them permissions, by default there three groups in VSD:

  • Administrators – essentially like csproot, but only for scope of this enterprise
  • Network Designers – limited to editing network templates and topology of the overlay in VSD
  • Everybody – default group where every user ends after creation with nearly no control rights

What we are going to do next is that we are going to add my admin/network designer user “petern” to the Network Designers group (this is because you do not need Administrators for the tasks we will be doing in this tutorial) and we will create a new group called “VM owners / applications” and add the “appuser” user to this group. This is to separate our special user to additional group and then we can simply give this group only limited permissions to “own” VMs connected to the topology, but not edit the topology. This is all following HPE DCN’s recommendation that network designers and compute/VM owners should be two separate groups.

In first part, lets create the new group called “VM owners / applications”:

Group creation process

Group creation process

Now that we have the additional group, lets add petern user to group “Network Designers”:

Adding user "petern" to group "netwrok designers" in VSD

Adding user “petern” to group “netwrok designers” in VSD

Next add “appsser” to “VM owners / applicaitons” group:

Addint user "appuser" to "VM owners" group

Adding user “appuser” to “VM owners” group

Step 3. Creating a virtual network

Now finally the great virtual network design work! HPE DCN has a concept of creating a network design as a template and then creating an instance of that template. So lets begin with what with re-logins from the VSD from csproot to our “network designer” user we created in previous step that for me is called “petern”.

Login as petern to the NetwrokGeekStuff enterprise (this user has network designer rights)

Login as petern to the NetwrokGeekStuff enterprise (this user has network designer rights)

Once logged in, we can create an L3 domain template, this is template on creating a layer 3 (OSI layers model should be known to you as network guy!) template, first as empty template simply:

Create an empty L3 template

Create an empty L3 template

Next, select that template, and we will start building a typical 3-tier network that will consist of:

  • DMZ zone – this is a security zone for separating front-end systems (like systems with access to Internet, but right now we do not have any internet here)
  • APPS zone – this is where application servers should be hosted, it is an internal zone for the enterprise
  • DB zone – this is where database servers should be hosted to be isolated from application servers they are serving

To create such template in VSD, select the template, and simply drag&drop three zone templates to the central black “router icon” like this, then you can edit the name of a zone. If you do this three times like on the pictures below, you will end with a nice 3 tier template with three zones.

Create L3 template

Create L3 template

Drag&Drop three zones to the template and rename

Drag&Drop three zones to the template and rename

13_zone_edit

Final view with three zones

Final view with three zones

OK, we have zones now. For the network however, we still need IP subnets, for this we need to drag to each zone at least one subnet, so drag&drop one subnet template to each zone, name them DMZ1 / APPS1 / DB1 and if you want, you can choose what IP ranges to use in each. I am going to start with a simple scheme of:

  • DMZ1 – 10.10.0.0/24
  • APPS1 – 10.20.0.0/24
  • DB1 – 10.30.0.0/24
Drag&drop subnet to a zone

Drag&drop subnet to a zone

Edit subnet's IP range

Edit subnet’s IP range

Final view if you add three needed subnets to all three zones

Final view if you add three needed subnets to all three zones

Step 4. Starting a virtual network instance

This is now actually a super quick step, simply select the template you want to start and hit the “Instantiate” button/icon below and give the instance a name.

Create an L3 template instance

Create an L3 template instance

Congratulations, you now have an instance running under the domains list with your instance name.

Step 5. Adding user permissions to your instance

Right now we have an instance running, but nobody other than admin has access and permission to actually deploy (like placing a VM) to this instance, we should at minimum setup these permissions. We can quickly assign these permissions with a few clicks.

  • Network Designers should have “DEPLOY PERMISSIONS” to the instance (things like doing live changes to instance)
    18_designers_permissions
  • VM owners / applicaitons should have “READ PERMISSIONS” to the instance (to know the topology)
    20_appuser_view_permission
  • VM owners / pplicaitons should have “USE PERMISSIONS” to each zone in order to be allowed to deploy a VM to it
    19_zone_permissions_for_VM_owners

After these steps, you have an instance and also basic permissions management established.

Step 6. Adding a VM to the network

Now things become interesting. HPE DCN is actually not adding VMs to the network by any particular action inside VSD. Adding a VM will be a simple vCenter tasks, the only thing we have to do in addition, is to edit the VM’s metadata and manually enter a few special parameters to indicate to which Enterprise / Instance / Zone / Subnet the specific VM should be placed.

What you need: OVF/OVA image of a small linux to play the role of customer VM server

Small linux OVF/OVA image to simulate customer VMs

Small linux OVF/OVA image to simulate customer VMs

I have created for myself a very small VM in a form of OVF/OVA image that only needs 128MB of RAM that I will be deploying via vCenter. If you do not have your own OVF/OVA image, I strongly suggest that you create one for yourself or download some from the internet. Alternativelly, you can install a normal VM in vCenter using traditional installation from installation media and then exporting that installed VM to an OVF/OVA directly from vCenter.

Step 6.1 Deploy OVF image in vCenter

The first step here is to simply use vCenters “Deploy OVF Template .. ” wizard to put a VM to one of the clusters. for first image, I am going to use the stand alone production cluster 192.168.10.133 that already has a VRS installed.

Deploy OVF image on ESXi host 192.168.10.133

Deploy OVF image on ESXi host 192.168.10.133

In regards to the deployment process, I only recomment that you name your VM based on the instance / zone / subnet you want to add it into, for example right now I want to add the VM to the following zones:

  • Enterprise: NetworkGeekStuff
  • Instance: Instance1
  • Zone: DMZ
  • Subnet: DMZ1

So I have named the VM as “Networkgeekstuff_DMZ_DMZ1_VM1“. I missed the intances to make the name a bit shorter and added “VM1” at the end indicating this is my first VM in this zone/subnet.

Naming the VM in OFV deployment

Naming the VM in OFV deployment

The only other mandatory task to show here is the fact that you have to add the VM to the “<ESXi host>-VMPG” port group when selecting the network interface configuration.

Network selection for the VM deployed MUST be on the ESXi hosts -VMPG port group!

Network selection for the VM deployed MUST be on the ESXi hosts -VMPG port group!

Step 6.2 Configuring VM’s metadata for HPE DCN’s overlay

Now we should have in the vCenter a new VM deployed like seen here:

OVF based VM deployed on ESXi host 192.168.10.133 - but not yet ready for boot

OVF based VM deployed on ESXi host 192.168.10.133 – but not yet ready for boot

What we need to do is to create for this VM items in the metadata (or VM options) that would drive this VMs assignment to the correct network landing. These options are:

  • nuage.user  – controls which VSD user this VM is associated with (the user has to have “USE PERMISSIONS” for the zone
  • nuage.enterprise – controls which VSD enterprise this VM is assigned to
  • nuage.nic0.domain – controls which VSD Instance this VM should be connected to
  • nuage.nic0.zone – controls which VSD zone this VM should be connected to
  • nuage.nic0.network – controls which VSD subnet this VM should be connected to
  • nuage.nic0.networktype – controls what type this interface is, right now this will be 99% of time simply “ipv4”

So lets find these options in the vCenter configuration, they are located under “Advanced” tab in the VM’s Manage-> Settings -> VM Options.

VM edit options location 1/2

VM edit options location 1/2

VM edit options location 2/2

VM edit options location 2/2

Now what we should add here is use the “Add Row..” button and add the following parameters (or modify to match your network instance):


  • nuage.user  – appuser
  • nuage.enterprise – NetworkGeekStuff
  • nuage.nic0.domain – Instance1
  • nuage.nic0.zone – DMZ
  • nuage.nic0.network – DMZ1
  • nuage.nic0.networktype – ipv4

Here is the result:

VM metadata extended with HPE DCN options

VM metadata extended with HPE DCN options


Step 6.3 Boot the VM and check if connected

So on this point we have VM that is ready to be booted and with all the nuage parameters correctly entered, the VRS should auto-detect the new VM, and report to VSC/VSD this new VM, whilc VSD/VSCs are going to coordinate this VMs successfull connection to the overlay fabric. So lets try this simply by booting the VM.

First indication that we have been successful is simply that the VM received an IP correctly, which we did as shown below. We received 10.10.0.107 what is a correct DMZ1 subnet IP. Second test is that you can ping the default gateway which is practically the VRS and created dynamically.

VM recieved IP from DMZ1 from HPE DCN

VM recieved IP from DMZ1 from HPE DCN

VM can ping its HPE DCN gateway that is effectively the closest VRS

VM can ping its HPE DCN gateway that is effectively the closest VRS

The second indication is that the VM is dynamically auto-detected in the VSD and you can see it in the network topology inside the subnet (click the subnet)

New VM detected in the network topology of Instance1 in VSD

New VM detected in the network topology of Instance1 in VSD

Additionally, the VM is visible under list of VMs that is handled by the VRS inside the 192.168.10.133 host that is

VM visible in the csproot monitoring under the local VRS

VM visible in the csproot monitoring under the local VRS

Step 7. Repeat previous step for more VMs

This is step is a placeholder for you to add more virtual machines to the topology, for my needs, I have added the same OVF template to other zones of APPS and DB to populate the topology, if you want you can us ANY ESXi host that has VRS installed and of course you can also add multiple more VMs to each zone/subnet as you want. My final view is this from VSD1 perspective as I have added two more VMs, one to APPS – APPS1 and one to DB – DB1 network.

The final L3 topology with VM in each zone

The final L3 topology with VM in each zone

Now the final test is of course trying to ping from one VM to another one, so lets try this, my first DMZ VM got IP 10.10.0.107, one of the other VMs in APPS zone has an IP 10.20.0.238, so lets try pinging them from each other.

What is this?!! It doesn’t work!!!

Blocked communication by default between zones in HPE DCN

Blocked communication by default between zones in HPE DCN

Now before you go screaming that HPE DCN is not working like I, the reason is actually by design that by default there is a policy that any input packets from VMs to the HPE DCN fabric are blocked, so we have to create a policy to unblock this first.

Step 8. Ingress/Egress Security Policies

As mentioned in Step 7, by default HPE DCN blocks any ingress packets from VMs to the fabric until allowed. This blocks zone-to-zone communication. So in this step, I am going to show you how to create some default filters that will permit our traffic.

Step 8.1. Create default “PERMIT ANY” ingress policy

If you simply want to allow everything for testing in your 3 tier network, you can simply go to “Ingress Security Policies”, hit plus sign and

Enable default ingress policy to forward IP packets

Enable default ingress policy to forward IP packets

The moment you hit apply on this policy, the ping test between VMs will start working.

Working zone-to-zone pings with default ingress policy applied

Working zone-to-zone pings with default ingress policy applied

Step 8.2 Advanced Ingress/Egress Policies

I am going to dissapoint you right now and will not cover the advanced policies now. In summary HPE DCN supports filters between zones / domains and even individual VMs, it also can do “reflexive” policies that partly simulates a statefull firewall (but again this is only like reflexive access-lists you maybe know from Cisco, it tracks TCP/UDP ports but doesn’t really track flags or sequence numbers and as such are not a replacement for a real firewall!). I will definitelly dedicate much more space to Ingress/Egress Policies in next parts of this series, but for now I recommend you read the user guide on HPE DCN to find more if you want to.

Step 9. (Optional) Homework VRS/VSC Verifications

Right now you are able to install HPE DCN, and experiment yourself. What I really recommend next is to go to VSC and VRS instances and try to explore their CLIs for low level information how your overlay network is mapped to underlay and how your pings are really forwarded over your network. So as homework I am going to leave you with a set of best VSC and VRS commands to try.

VSC

  • show vswitch-controller vsd
  • show vswitch-controller vswitch
  • show vswitch-controller virtual-machines
  • show vswitch-controller virtual-machines enterprise “NetworkGeekStuff”
  • show vswitch-controller vports type vm enterprise “NetworkGeekStuff”
  • show vswitch-controller ip-routes enterprise “NetworkGeekStuff” domain “Instance1”
  • show vswitch-controller vports vport-name <vportname> acl ingress-security
  • show vswitch-controller vports vport-name <vportname> acl egress-security
  • show vswitch-controller <generally anything behind this command is of interest>

Note: On VSC you will find two different numbers for L3 domain instance, one is VPRN and another is EVPN. The VPRN is technically a VRF (or VPN-INSTANCE in HPE terminology) that your L3 instance logically creates and EVPN is technically a L2 VS (virtual switch instance), since VSC is practically a router you can see details about this VPRN (really “VRF”) and EVPNs using commands like:

  • show service id <VPRN number> base
  • show service id <EVPN number> base
  • show vswitch-controller ip-routes enterprise “NetworkGeekStuff” domain “Instance1”

VRS

  • ovs-vsctl show
  • ovs-appctl vm/show
  • ovs-appctl vm/port-show <VM UUID from previous command>
  • ovs-appctl bridge/acl-table
  • ovs-appctl vm/dump-flows <VM UUID from previous command>
  • ovs-appctl evpn/mac-table <VM UUID from previous command>
  • ovs-appctl bridge/dump-flows alubr0
  • ovs-dpctl dump-flows

Summary

After completing this lab, you should know how to do basic topology in HPE DCN (or Nokia’s Nuage SDN) and together with previous part 1 know how to install it in your lab.

In next parts I plan to extend on this lab to create more redundancy (adding redundant VSCs and VSDs) and then go into configuring Nuage via REST API and maybe do some outage scenarios. Stay tuned for more coming soon!

Index of article series:

References


[minipost] Capturing bidirectional traffic of virtual machine (VMs) on vmWare ESX 6.x

$
0
0

Here I was getting a trouble with communication between an ESX virtual machine and the nearby switch (Nuage/DCN controller VM talking with a VTEP switch if someone is interested) and because that switch was direct destination of the control plane packets (OVSDB over TCP) I was not having much success creating a mirroring interface on the switch. So I learned how to capture a specific virtual machine traffic directly on the ESXi host’s SSH console and to not forget that, I will document this here.

Step 1 – enable SSH to the ESX host

In most cases this is not running by default, so go to the ESXi server direct terminal or iLo and via “F2″enter system customization and enter troubleshooting section:

ESX host troubleshooting options location

ESX host troubleshooting options location

Right behind this menu should be “SSH Enable” option, and you simply hit that with enter 😉

ALTERNATIVE: If you have vCenter deployed, you can use its GUI to enable SSH on a specific host like this:

Locate ESX Host in vCenter and open its security profile

Locate ESX Host in vCenter and open its security profile

Inside security profiles enable SSH server

Inside security profiles enable SSH server

Step 2 – locating switchport ID

My virtual machine was called “DCN4.0R5_VSC1” and was simply connected to logical vswitch0 in ESX hosts operation. However what we need to find out is the numerical id of the specific switch port. To do this we have two possible paths, first options is to check “net-stats -l” in ESXi hosts SSH console like this:

[root@esxm1:~] net-stats -l
PortNum          Type SubType SwitchName       MACAddress         ClientName
33554495            5       7 vSwitch0         00:50:56:b2:20:bb  DCN4.0R5_VSC1
33554496            5       7 vSwitch0         00:50:56:b2:1f:cd  DCN4.0R5_VSC1

ALTERNATIVE if you do not know your VMs name or you would like to know what portgroup it is connected to, you can use “esxcli” commands like this:

[root@esxm1:~] esxcli network vm list
World ID  Name              Num Ports  Networks                              
--------  ----------------  ---------  --------------------------------------                    
 2615418  DCN4.0R5_VSC1             2  VPC SDN Underlay, Network Devices Mgmt

And then details of the port of your VM with:

[root@esxm1:~] esxcli network vm port list -w 2615418
   Port ID: 33554495
   vSwitch: vSwitch0
   Portgroup: VPC SDN Underlay
   DVPort ID: 
   MAC Address: 00:50:56:b2:20:bb
   IP Address: 0.0.0.0
   Team Uplink: vmnic2
   Uplink Port ID: 33554437
   Active Filters: 

   Port ID: 33554496
   vSwitch: vSwitch0
   Portgroup: Network Devices Mgmt
   DVPort ID: 
   MAC Address: 00:50:56:b2:1f:cd
   IP Address: 0.0.0.0
   Team Uplink: vmnic2
   Uplink Port ID: 33554437
   Active Filters:

Step 3 – running the capture

The funny part is that on ESX there exists a command pktcap-uw to capture traffic on a specific VM’s interfaces, for example for the VMs I was targeting I would run this command (with traffic captured going to /tmp/ ):

pktcap-uw --switchport 33554495 -o /tmp/33554495.pcap

However this command is by default a unidirectional and we have to trick our way around to get bidirectional traffic. There is a selector switch in this commend “–dir 1” that captures input packets and “–dir 0” that captures output packets and what we can do this by using the good old “&” run two captures in parallel capturing both directions into separate files like this:

pktcap-uw --switchport 33554495 --dir 0 -o /tmp/33554495_in.pcap & \
pktcap-uw --switchport 33554495 --dir 1 -o /tmp/33554495_out.pcap &

The above will start two captures in the background. To stop this capture, you can either list the processes using “lsof” command and then stop them by killing them using “kill <number>” manually, or using this great trick by parsing all kill processes from lsof to the kill command using awk:

kill $(lsof |grep pktcap-uw |awk '{print $1}'| sort -u)

The result isthat you will have two pcap files, one for each direction, but how to put these together for a coherent capture file? Next step is for that 😉

Step 4 – Merging two unidirectional pcap files to one bidirectional

Actually since both pcap files were captured on one system (with one internal clock), the pcap files have a synchronized timestamp marking packets, therefore a simple merge with utility called “mergecap“, which is part of wireshark installation on both linux and windows, is all that we need. For example:

Windows mergecap example:

C:\Program Files\Wireshark>mergecap.exe -w C:\Users\havrila\Downloads\33554495_merged.pcap C:\Users\havrila\Downloads\33554495_in.pcap C:\Users\havrila\Downloads\33554495_out.pcap

Linux ergecap example:

$ mergecap -w ./33554495_merged.pcap ./33554495_in.pcap ./33554495_out.pcap

And that’s it, you can now open 33554495_merged.pcap in wireshark and see your ESX VMs traffic as a normal bidirection traffic capture. Enjoy.

PS: If you wonder about timestamps inside pcap files, or in the future would have two captured files from two systems that do not have clocks synchronized and would want to merge files like that, have a look on capinfos and editcap utilities from wireshark. You can offset timing with them very easily (editcap -t <offset> A.pcap B.pcap).

HPE’s DCN / Nuage SDN – Part 3 – REST API introduction

$
0
0

REST-full API, the new trendy bandwagon of cloud automation and SDN due to its simplicity and universal compatibility. TI is essentially a http transfer protocol with JSON payload. And if I confused you here, please stay calm, we are still doing networking here, we will just try to use a different control mechanism than good old console or visual GUI for the sake of automation later. Also here on this site we already had one exposure to REST API use with the HP’s SDN controller both using raw curl and automation of this controller using perl web application as tutorials.

Index of article series:

Introduction to part #3 about REST API

I was thinking for a long time how to structure this article, and at the end I decided. That instead of showing too much boring REST API calls, I am going to show only a few elemental REST API calls of Nuage, but from different points of view. We will start with some Intro notes on reverse-engineering VSD GUI’s REST API calls and REST API documentation of Nuage/DCN, then follow-up using cURL to play with the REST API calls and after we have enough of console we switch to POSTMAN application (which is a higher level editor of REST API calls) and at the very end, I am going to show you one quick-n-dirty web application that is using REST API towards Nuage created in perl.

All these sections are really very elemental as they are all going to show you a simple quadruplet of authentication, reading, creating and deleting a simple REST API object that represents a Nuage enterprise in the VSD. Then it will be up to your specific need which path you will pursue deeper.

1. “Reverse engineering” Nuage’s VSD GUI’s REST API calls

Ok, firstly, when you have VSD installed, it’s REST API documentation is available in https://<YOUR VSD IP ADDRESS>:8443/web/docs/api/V4_0/API.html

Secondly, the important part here is that the VSD GUI that we used in previous part of this series is actually completely based on REST API. This means that every single action that you do in this GUI is actually starting a REST API call in the background. And this is what we are going to help us here with a little bit of reverse engineering these calls. You actually capture this traffic using wireshark, but the easiest way how to do this is to install a firefox “firebug“plugin.

This plugin enables you to monitor HTTP session communication that the GUI generated between your browser and the VSD REST API interface and this way you can easily learn what REST API calls are part of each of the different actions you do. For example, install firebug, open the default login page of VSD and in the firebug bottom control area select Net -> All like this:

(NOTE: You will see on the pictures below that my lab VSD is using  TCP port 3389, this is a PORT-FORWARDING port as VSD is normally using port TCP 8443, so do not get confused as this is specific for my lab, your VSD should always have both VSD GUI, REST API and REST API documentation using 8443 as port!)

REST API reverse-engineering with Firebug

Once you enter your authentication login / password, you will notice that firebug will show you all the REST API calls that the GUI have done in the background to authenticate you and also show you the entry page.

Firebug trace of REST API calls of authentication

So above you can see that to login, it used /nuage/api/v4_0/me call and then loaded all licenses and enterprises overview using the /nuage/api/v4_0/licenses and /nuage/api/v4_0/enterprises REST API calls. Next, lets see how it looks when you create something, lets declare a new enterprise called “HelloWorld2”.

Creation of new Enterprise with firebug ready to capture all REST API

REST API calls of new Enterprise declaration using a POST method

As you can see, it is the same target URL, but using POST method to send new data towards VSD and subsequent GET request to re-read if the new Enterprise was created. The last part before we jump into JSON payload is removing the HelloWorld2 enterprise.

Preparing firebug to capture REST API calls responsible for deleting an enterprise

REST API calls for removing an enteprise consisting of DELETE and subsequent checks if deletion was successfull.

Ok, now here is the interesting part about DELETE method in HTTP, in order to know if the HTTP transaction was correct and/or the deletion itself was correct, the REST API will actually return positive 300 status call giving you visual warning in the GUI (ergo a confirmation message will pop-up on VSD), only when you select “OK” to confirm the deletion it will send a second DELETE method with the response choice and you get no response content back. Subsequently the GUI will read the enterprises list again to know if the deletion was correct.

2. Raw REST API examples using cURL

2.1 Reading enterprises list using curl

Now that you have seen how the VSD GUI is using REST API, we can do exactly the same actions using linux curl syntax. So let’s start with authentication, the whole purpose for this is to get authentication token called “APIKey”, in my case I can achieve this simply with this command :

$ curl -u csproot:csproot -k \
-X GET https://15.163.248.11:3389/nuage/api/v4_0/me \
-H "Content-Type:application/json"; \
-H "X-Nuage-Organization:csp" | python -mjson.tool

RESPONSE:

[
    {
        "APIKey": "4724ef0b-1f37-4817-941d-76a3001dc2f7",
        "APIKeyExpiry": 1482751936254,
        "ID": "8a6f0e20-a4db-4878-ad84-9cc61756cd5e",
        "avatarData": null,
        "avatarType": null,
        "elasticSearchUIAddress": null,
        "email": "csproot@CSP.com",
        "enterpriseID": "76046673-d0ea-4a67-b6af-2829952f0812",
        "enterpriseName": "CSP",
        "entityScope": null,
        "externalID": null,
        "externalId": null,
        "firstName": "csproot",
        "flowCollectionEnabled": false,
        "lastName": "csproot",
        "licenseCapabilities": [
            "ENCRYPTION_ENABLED"
        ],
        "mobileNumber": null,
        "password": null,
        "role": "CSPROOT",
        "statisticsEnabled": false,
        "userName": "csproot"
    }
]

To explain the curl command a little:

  • -u csproot:csproot  –> basic authentication of http protocol to give our normal username and password to Nuage
  • -k –> this is disables a check of the SSL certificate, this is needed becuase in my lab I am using a self-signed certificate that VSD generated by default, if you have a real certificate from public CA in your VSD, you can remove this.
  • -X GET https://15.163.248.11:3389/nuage/api/v4_0/me  –> this is the HTTP standard method or command to use  on the remote side, this is for use practically the URL of the REST API target
  • -H “Content-Type:application/json” and -H “X-Nuage-Organization:csp” –> the “-H” parameters adds extra header key/value pairs to the HTTP request, in our case we need to specifici that the payload is a JSON and Nuage also needs to know what organization context the user authentication is coming from (similarly like your VSD GUI login you need to enter organization).
  • | python -mjson.tool –> This is optional part to achieve a nice human readable structure of the JSON reply once it arrives, I am hijacking a python library as this one is available quite often, optionally you can remove this part from the command.

Or of course if you want to simly filter out the APIKey then one more “grep pipe”:

sh-4.1$ curl -u csproot:csproot -k \
-X GET https://15.163.248.11:3389/nuage/api/v4_0/me \
 -H "Content-Type:application/json"; -H "X-Nuage-Organization:csp" \
| python -mjson.tool | grep APIKey
"APIKey": "4724ef0b-1f37-4817-941d-76a3001dc2f7",

2.2 Creating new Enterprise with curl

So now we have the APIKey in its cryptic form, we can continue with displaying all the Nuage enterprises with another curl command, but this time we use the APIKey as authentication password like this, however to avoid this article to become a collection of super-large JSON texts I am going to filter using grep only the enterprise name and its ID:

sh-4.1$ curl -k -u csproot:4724ef0b-1f37-4817-941d-76a3001dc2f7 \
https://15.163.248.11:3389/nuage/api/v4_0/enterprises \
-H "Content-Type:application/json" \
-H "X-Nuage-Organization:csp" \ | python -mjson.tool \
| grep -E '"ID"'\|'"name"'

RESPONSE:

"ID": "85789b45-a35a-4b4a-8ddd-d39e00021fa9",
        "name": "HelloWorld1",

Next, lets try to actual create a new enterprise definition by pushing back to the VSD a new enterprise called “HelloWorld2”, we simply push this as a curl command utilizing a http POST method with JSON paylod that specifies the HelloWorld2 name:

sh-4.1$ curl -k -u csproot:4724ef0b-1f37-4817-941d-76a3001dc2f7 \
-X POST https://15.163.248.11:3389/nuage/api/v4_0/enterprises \
-d '{"name":"HelloWorld2"}'  \
-H "Content-Type:application/json" \
-H "X-Nuage-Organization:csp" \
| python -mjson.tool

The important parts to remember here are:

  • -x POST https://15.163.248.11:3389/nuage/api/v4_0/enterprises  –> This changes the HTTP method to a POST that sends data payload to the VSD instead of reading something.
  • -d ‘{“name”:”HelloWorld2″}’  –> This is a very simply JSON payload for the POST that declares a single key/value pair for the enterprise name.

OPTIONAL: Create new enterprise linked with enterprise-profile

After the above example with HelloWorld2, you might be asking what enterprise profile was linked to it, it is true that the answer is actually “none”, because we didn’t specified any profile, if you want a new enterprise linked with a profile, we need an ID of such profile first, luckily in our reverse-engineering of the VSD above, when you are in the enterprise declaration GUI, there is a REST API going for nuage/api/v4_0/enterpriseprofiles to achieve exactly that, so lets get again name and ID of all enterprise profiles like this:

sh-4.1$ curl -k -u csproot:4724ef0b-1f37-4817-941d-76a3001dc2f7 \
https://15.163.248.11:3389/nuage/api/v4_0/enterpriseprofiles \
-H "Content-Type:application/json" -H "X-Nuage-Organization:csp" | \
python -mjson.tool  | grep -E '"ID"'\|'"name"'

RESPONSE:

"ID": "f1e5eb19-c67a-4651-90c1-3f84e23e1d36",
        "name": "Default Profile",

As you can see above, I only have the “Default Profile” in my lab, so we will create another enterprise based on this one called HelloWorld3 and the creation curl REST API will then look like this:

sh-4.1$ curl -k -u csproot:4724ef0b-1f37-4817-941d-76a3001dc2f7 \
-X POST https://15.163.248.11:3389/nuage/api/v4_0/enterprises \
-d '{"name":"HelloWorld3","enterpriseProfileID":"f1e5eb19-c67a-4651-90c1-3f84e23e1d36"}'  \
-H "Content-Type:application/json" \
-H "X-Nuage-Organization:csp"

RESPONSE:

[
    {
        "BGPEnabled": false,
        "DHCPLeaseInterval": 24,
        "ID": "ff9221e0-47f9-46c2-aa44-ae2fb42fa54f",
        "LDAPAuthorizationEnabled": false,
        "LDAPEnabled": false,
        "allowAdvancedQOSConfiguration": false,
        "allowGatewayManagement": false,
        "allowTrustedForwardingClass": false,
        "allowedForwardingClasses": [
            "H"
        ],
        "allowedForwardingMode": null,
        "associatedEnterpriseSecurityID": "d1fc0d9e-a9e1-4c04-894c-5993057b307a",
        "associatedGroupKeyEncryptionProfileID": "8873a09f-2fb9-4b50-92c4-caa4533fb3f4",
        "associatedKeyServerMonitorID": "7b5041a1-609d-45c1-bc6b-a8f1d45f0ca6",
        "avatarData": null,
        "avatarType": null,
        "children": null,
        "creationDate": 1482684131000,
        "customerID": 10009,
        "description": null,
        "dictionaryVersion": 1,
        "enableApplicationPerformanceManagement": false,
        "encryptionManagementMode": "DISABLED",
        "enterpriseProfileID": "f1e5eb19-c67a-4651-90c1-3f84e23e1d36",
        "entityScope": "ENTERPRISE",
        "externalID": null,
        "floatingIPsQuota": 16,
        "floatingIPsUsed": 0,
        "lastUpdatedBy": "8a6f0e20-a4db-4878-ad84-9cc61756cd5e",
        "lastUpdatedDate": 1482684131000,
        "localAS": null,
        "name": "HelloWorld2",
        "owner": "8a6f0e20-a4db-4878-ad84-9cc61756cd5e",
        "parentID": null,
        "parentType": null,
        "receiveMultiCastListID": "081169f6-cb2f-4c6e-8e94-b701224a5141",
        "sendMultiCastListID": "738446cc-026f-488f-9718-b13f4390857b"
    }
]

As you can see, we simply referenced the enterpriseProfileID in the JSON payload.

2.3 Deleting enterprise using curl

So now we have created a new enterprise called “HelloWorld2”, already from the creation response we know its ID (or if you didn’t noticed just read all the enterprises via REST API and mark the ID part) of ff9221e0-47f9-46c2-aa44-ae2fb42fa54f. So let’s delete it using the DELETE method, please note that here we are specifying the enterprise to be deleted by making it part of the URL and not payload:

curl -k -u csproot:4724ef0b-1f37-4817-941d-76a3001dc2f7 \
-X DELETE https://15.163.248.11:3389/nuage/api/v4_0/enterprises/ff9221e0-47f9-46c2-aa44-ae2fb42fa54f \
-H "Content-Type:application/json" -H "X-Nuage-Organization:csp" \
| python -mjson.tool

However the response is not as simple as in previous instances, here the REST API is actually asking us for confirmation.
RESPONSE:

{
    "choices": [
        {
            "id": 1,
            "label": "OK"
        },
        {
            "id": 0,
            "label": "Cancel"
        }
    ],
    "errors": [
        {
            "descriptions": [
                {
                    "description": "Once an enterprise is deleted, it cannot be recovered. Are you sure you want to delete enterprise 'HelloWorld2'?",
                    "title": "Delete enterprise"
                }
            ],
            "property": ""
        }
    ]
}

To confirm the selection of option #1 – OK, you have to send a subsequent DELETE message by adding “?responseChoice=1” to the URL (essentially creating a PUT parameter here):

curl -k -u csproot:4724ef0b-1f37-4817-941d-76a3001dc2f7 \
-X DELETE https://15.163.248.11:3389/nuage/api/v4_0/enterprises/ff9221e0-47f9-46c2-aa44-ae2fb42fa54f/?responseChoice=1 \
-H "Content-Type:application/json" -H "X-Nuage-Organization:csp"

Hint: You can actually delete enterprise on single curl DELETE message if you use the responseChoice=1 immediately ;), there is no need to first get the choice question in advance!

3. REST API a bit nicer using Chrome’s POSTMAN

Now this part is essentially a small evolution of my own path trying to figure out what is the best way to create for myself a library of Nuage REST API calls for reference and experiments, curl is great, but it is hard to share with colleagues and function as a documentation. So at the end I started using POSTMAN, an application from the Chrome APPS environment (but practically runs standalone) that functions as a high level REST API editor and  has some neat scripting capabilities to enable us to automate some Nuage REST API specifics.

I would also like to state here that I will go via these examples in a quick-n-dirty fashion to show how cool this is, but I will not bother explaining POSTMAN in detail as that is what you can find in POSTMAN Documentaiton, including a nice “GettingStarted” part.

3.1 Download my POSTMAN collection for Nuage

In the examples below I expect you to download my POSTMAN collection of REST API calls from here and a few global environment variables from here.

After you have these two files, this is how to import and what to check if import was correct:

  1. Import via big “Import” button in Postman both collection and global variables file from above download links
  2. Check that the collection “Nuage-REST-API” now exists and has five REST API calls inside
  3. Check if global variables exists just like on this picture

Postman imported REST API calls and global variables

Afterwards you have to edit the global variables VSD_IP and VSD_PORT using the “edit” button and change these to your VSD IP address and port (by default the port is 8443).  These changes will prepare Postman to work in your environment.

3.1 Authenticating to Nuage using POSTMAN

Unfortunatelly Postman has troubles importing authentication headers definition, so to avoid this problem we have to do something special before starting each call. On the first authentication REST API call, click on the “0_Basic_Auth” method from the imported collection, open “Authorization” tab and select “BasicAuth” from drop down, then enter {{VSD_USER}} and {{VSD_PASSWORD}} to the username and password fields and click “Update Request” button.

Preparing the authentication REST API before start

For your information the syntax of {{VARIABLE}} instructs POSTMAN to take the variable data from the global variables, so if you look at the picture above, you can see both the authenticaiton and also the URL, which is using {{VSD_IP}} and {{VSD_PORT}} to construct REST API call towards the VSD for requesting the APIKey just like in previous methods.

If everything looks correct, you can hit the “Send” button and after a moment a response JSON should appear like below:

Starting first authentication POSTMAN call and getting a response

As you can see, we have received “APIKey” in the response, now it would be a good time to take this key and make it a new global variable to be used in the follow-up REST API calls. BUT I do not want to do this manually! With the power of POSTMAN you can have javascript code extracting and doing this for you! And actually if you check the global variables, it is already there because I have created such javascript and it is already part of your collection. See below as part of the “Tests” tab:

var jsonData = JSON.parse(responseBody);
postman.setGlobalVariable("APIKey", jsonData[0].APIKey);

POSTMAN extracting token via script to global variables itself!

This is a great principle and we will be using it even more in follow-up calls below.

3.2 Listing Enterprises via POSTMAN

Ok, again the same drill, open “Authorization” and update the “Basic Auth” by pointing to global variable {{VSD_USER}} and {{APIKey}}, and hitting “Update Request” button like below:

Update POSTMAN authentication to use the new APIKey variable

Now you can again hit “Send” and you should recieve a full JSON data response with all the enterprises that exist on the VSD. Since this is something we seen several times already from curl examples, I am going to skip this in postman to save space 😉

3.3 Creating new Nuage Enterprise via POSTMAN

We will create a new enterprise called “Postman_Enterprise”, there is already a prepared REST API call called “2_Create_Enterprise” in the collection using a POST method and in this one, the important part is that it has a body payload with the name of the new enterprise, see below:

Postman using POST method with JSON data payload for enterprise creation

Once you hit “Send” you will receive a JSON response identical like with the GET listing of the new enterprise. You can also check VSD GUI that the new enterprise appeared.

3.4 Searching for enterprise ID using javascript

This is now call called “3_Get_Enterprises_find_ID_with_script” that is from REST API perspective identical like the enterprise listing that we already had in section 3.2, but the difference here is that using some basic javascript we can search for an ID of a specific enterprise. So imagine I need to find an ID of the enterprise “Postman_Enterprise” that we created in previous step. Manually searching the JSON is possible, but I want to again automatically find it and have POSTMAN to create a global variable automatically, I can achieve this using a strip in the “Tests” section like this:

var jsonData = JSON.parse(responseBody);
var arrayLength = jsonData.length;
for (var i = 0; i < arrayLength; i++) {
    if( jsonData[i].name === "Postman_Enterprise" ){
        postman.setGlobalVariable(jsonData[i].name, jsonData[i].ID);
    }
}

POSTMAN javascript to seach for enterprise “Postman_Enterprise” ID and create global variable from it

3.5 Deleting an enterprise (using ID found in 3.4)

This last example is again very straightforward because the call “4_DELETE_found_ID_from_previous” is already prepared to use the enterprise ID captured in previous part (3.4) and delete this enterprise without a confirmation dialog. If you explore this call, you can notice that it is simply targeting and URL like below, and using DELETE http method:

https://{{VSD_IP}}:{{VSD_PORT}}/nuage/api/v4_0/enterprises/{{Postman_Enterprise}}/?responseChoice=1

This will directly delete the “Postman_Enterprise” enterprise from VSD on one click of the “Send” button as all the global variables are available to fill in this request completely. Also note that there will not be any response payload for this REST API call, the enterprise will simply disappear from VSD.

4. Building web application with REST API calls to Nuage

The title is a little bit critic, the practical benefit here is that with the REST API calls exposed, you can potentially build your own alternative GUI and stop using the Nuage VSD architect at all, or alternatively if you have customers of your own, and you do not want to give them full access to the VSD, you can build them a limited front-end (maybe combined with a payment/business logic). The sky is the limit. My own motivation for building an alternative web GUI is for testing purposes as I personally plan to follow-up with this application by creating a performance and limit testing application. For example I will be testing how VSD can handle thousands of enterprises, domains, networks, etc … and I really do not want to create these manually in VSD GUI.

For this reason I called this application (for now as working title) Nuage Troll. It is written in perl and if you want to play with it, you can download it here and load it to apache with perl CGI module. This software is using a simple Bear License (which means that if you find this usefull, you have to buy me a beer if we ever meet in person).

4.1 Exploring “Nuage Troll” alpha version

I really have to stress here that I spent maybe 60 minutes right now for creating this quick application and regular readers will also notice that this is actually a hijacked code of NodeCutter from previous article about the SDN controller application that was also REST API based. I used the same principle of perl-CGI web interface, that runs REST API calls using perl’s JSON and LWP libraries. At this point this application enables authentication for retrieving the APIKey and then to display basic lists of enterprises, domains, zones and subnets from the VSD (yes, missing write/delete at this point). I am going to simply show you the GUI point of view as in the download above, you can actually have a look on the perl code yourself.

4.1. Login to VSD using Nuage Troll

If you downloaded the Nuage Troll from above link, deployed it on apache webserver with perl-CGI enabled, you should see the following when you access its main directory (and index.cgi inside):

Nuage Troll – welcome screen

As indicated by the fields, you should put there the VSD IP and port (default is 8443) and change credentials if you are using something else than default. Then you can hit “Submit” as indicated below and you should receive APIKey if successful.

Successfully APIKey retrieval from Nuage Troll

After the APIKey is retrieved, a new button to access the main menu appears, hit this button now to access main menu and this is what you should see next:

Nuage Troll – main menu

4.2 Reading enterprises/domains/zones/subnets in Nuage Troll

Right now the only capability of Nuage Troll is to read all enterprises, domains, zones and subnets as names from the VSD using REST API, more development is to be done later as needed from my work, but that will be fore next article. For now let’s say that in VSD I have to following enterprise called “HelloWorld1” with a nice network topology:

VSD GUI view on “HelloWorld1” enterprise and it’s topology

At this point as Nuage Troll is in it’s early prototype, I am not going to bother you with more screenshots, but essentially everything the system can read right now is presented as a simple list, so if you click on “zones” you will get a full list of zones in the main display area like this:

Nuage Troll – list of zones

Summary

So we went through ways how to understand (e.g. reverse-engineer) the Nuage/DCN’s native VSD GUI to understand the REST API that it uses. Then I showed you how to do basic operations using both cURL and POSTMAN to interact with VSD using REST API and at the end showed you my quick-n-dirty experiment application to play with REST API of Nuage using perl-CGI based application that I called “Nuage Troll” (yep, very much working title as already after 60minutes of development it lost it’s appeal to me and will be most probably renamed soon).

The ball is not with you, if you have plans with Nuage as the Overlay orchestration solution, there will sooner or later be a need to interact with it beyound the VSD GUI, the REST API interface is “THE” interface of choice for everything, be it doing a simple scripts with cURL or developing your own front-end, I really do hope this article is a useful starting point for whatever direction you will go next.

For me this part #3 concludes this series of Nuage/DCN tutorials. I have a feeling there might be more articles about Nuage/DCN here that will be more specialized (like playing with Nuage/DCN integration with HP Networkings physical switches or further development of Nuage Troll), but right now you should have general idea what Nuage/DCN is about, its main components and interaction both using VSD GUI from part #2 and REST API from this part.

As always, thanks for reading!

Index of article series:

Example of private VLAN isolation across Virtual and Physical servers using ESX/dvSwitch and HP Networking Comware switches

$
0
0

The target was simple, we have an internal cloud datacenter at work that provides users and customers both virtual machines and physical machines. Each machine has to network interface cards (NICs), one is in control of the user/customer using SDN layer, the secondary NIC is for our support to monitor and help troubleshoot these machines when needed. This second NIC will be our target today. In the past we used per-user or per-customer firewall separations that was configuration intensive nightmare, but was reliable. However since we learned private VLANs are now supported by vmWares Distributed vSwitch (dvSwitch), we immediately tried to make it cooperate with private VLANs on physical switches. And since it worked like a charm, let me share with you a quick lab example. But theory first!

Theory of separating management rail between different customers with and without private VLANs

Solving management separation with a lot of subnets and firewalls

Fortunately Private VLANs arrived for most major vendors and promissed the ability to have one giant subnet and separate every host from each other on L2 using some basic principle of declaring ports as either promiscuous (can talk to any other port type), community (can talk to ports of the same community or promiscuous) and isolated (can really talk to only the promiscuous ports).  For our need, we can simply declare the firewall port to be promiscous (so it can accept all traffic) and all other ports as isolated (so they can only talk to the firewall and not each other) and this would be a clear case of private VLANs. HOWEVER if only the network was full of physical servers only on any network hardware vendor, be it Cisco, Juniper or HPN. But what happens when virtual machines enter this scenario? Well, because hypervisors use internal software switches, the VMs might leak communication to each other since private vlans are only enforcing separation on physical links. Look at this scenario with VM behind hypervisor:

vmWare’s dvSwitch leaked traffic between two VMs because private VLANs are only implemented on physical switch ports

So what can we do here to solve this between VMs and PMs ? Simple, teach the virtual switches the private VLANs principle of using dot1q tags on trunks. You see, the private VLAN standard declared a way how to do private vlan in multi-switch topology by using primary (for promiscous ports) and secondary VLAN tags (community/isolated) and marking packets based on these tags based on source port type whenever the switch needed to push the packet via a trunk. There is a nice explanation on packetlife.net here of this, so I will jump right at applying this to virtual switches.

First, lets create in our lab two VLAN tag IDs, I will use VLAN 1000 as primary and VLAN 1001 as secondary.

Basic principle of primary and secondary private VLAN IDs when moving between switches

This means we can create a single shared subnet for management of all customer systems, both VMs and PMs, but we need to configure private VLANs on all physical switches, all virtual switches and use the same VLAN tages for primary and secondary VLANs. Our target here will be something like this:

Working private VLAN isolation across VMs and PMs by teaching ESX dvSwitch our private VLAN IDs

LAB Topology

Now let’s get practical, this was my lab setup below on picture. Target is to achieve complete isolation of all VMs and PMs on the network, while at the same time allow all these systems to use default gateway, which was a VRRP IP on interface vlan on the switches.

Private VLANs between VMs and PMs – LAB topology

I was using ESX hosts version 6.0 and HPN 5940 series switches with Comware 7 – R2508 version.

Configuring HPN switches for Private VLANs

Ok, lets configure the HPN’s 5940 first, it all starts with the private VLAN definition:

#Create primary privte vlan
vlan 1000
 private-vlan primary
 name Management Private VLAN
 quit

#Create secondary vlan and define it as "isolated" type
vlan 1001
 # THESE TWO COMMANDS BECAUSE VLAN 1001 can talk to VLAN 1001
 private-vlan isolated
 undo private-vlan community
 quit

#Go back to primary vlan and tie it with secondary VLAN
vlan 1000
 private-vlan secondary 1001
 quit

Next lets look at the interfaces towards ESX hosts, this is easy, we simply define them as normal trunks! So if you already had these as trunks, there is nothing much else to do here and the TenGigabit 1/0/1 interface in my lab looks like this:

interface Ten-GigabitEthernet1/0/1
 port link-mode bridge
 description link to ESX Nodes
 port link-type trunk
 port trunk permit vlan all

Following up with port towards the host, and this is interesting, because you need to configure your port like this:

interface Ten-GigabitEthernet1/0/2
 port link-mode bridge
 description link to physical server to isolate
 port link-type access
 port access vlan 1001
 port private-vlan host

But the funny part is, that the private-vlan host command at the end is actually a macro, that will extend itself into several hybrid

interface Ten-GigabitEthernet1/0/2
 port link-mode bridge
 port link-type hybrid
 undo port hybrid vlan 1
 port hybrid vlan 1000 to 1001 untagged
 port hybrid pvid vlan 1001
 port private-vlan host

And the grand finale, creating a promiscuous gateway interface is usually done on a physical port towards a router, but in my scenario (and actually our production scenarios) we need to create a gateway router as vlan interface locally on a nearby switch, luckily, HPN switches support this and the configuration look like this:

# Switch 1
interface Vlan-interface1000
 private-vlan secondary 1001 
 ip address 29.203.176.2 255.255.252.0
 vrrp vrid 1 virtual-ip 29.203.176.1
 vrrp vrid 1 priority 110

# Switch 2
interface Vlan-interface1000
 private-vlan secondary 1001 
 ip address 29.203.176.3 255.255.252.0
 vrrp vrid 1 virtual-ip 29.203.176.1
 vrrp vrid 1 priority 90

Well, that is, only a few extra commands on top of the very familiar vlan declarations and interface configurations, so this should not be any issue for you. And I would guess also for other vendors.

Configuring vCenter’s Distribuged vSwitch (dvSwitch) for Private VLANs

Moving on to the vmWare world, this part was actually what I didn’t know originally and needed to research (link below in external guides links). But it is very easy indeed as this is really just a few configuration steps on a centralized dvSwitch settings.

Note/Disclaimer: This guide expects that you have an ESX host that is using a Distributed vSwitch (dvSwitch) deployed across all your ESX nodes. In my lab I had two nodes called Node #1 and Node #2 (as visible in the lab topology picture above).

Step #1:  Find the dvSwitch entity and configure the VLAN 1000 as primary and 1001 as secondary – isolated.

Find “Private VLAN” settings on distributed switch entity

Configure vlan 1000 as primary and 1001 as secondary with type set to isolated

Step #2: In the configuration of the portgroup, where your VMs are connected to, assigned it to the isolated VLAN.

Find the portgroup in which your VMs are connected to with their interfaces

… assign the portgroup the to the secondary private VLAN 1001

Results & Summary

As was our target all along, after this configuration, all the VMs and the physical server in the topology are not capable of accessing each other as they are members of the isolated secondary VLAN 1001, but they can access the promiscuous gateway interface (hosting VRRP gateway IP) because it is assigned to primary VLAN 1000.

See external guides:


[minipost] Protecting SSH on Mikrotik with 3-strike SSH ban using only firewall rules

$
0
0

After working with Mikrotik / RouterBoard routers for a long time, I recently needed to replace an aging old wifi router at my parents and the recent brand of very cheap Mikrotik WIFI integrated routers (RB941-2nD-TC shown on left) that you can get under 20,-EUR was a great deal with an added bonus that I want to manage all this remotely and not visit physically every time there is a wifi problem.  So following my previous post on how to put a little script into Mirkotik to email you it’s public address whenever it changes (a mandatory to manage parent’s home router using dynamic public IP from ISP) I was also concerned about publicly opened SSH port and wanted at least basic protection on it. Most of you are probably using already some great tool such as fail2ban on linux, that scans log files and if it notices three bad logins to SSH from an IP, it will put the IP into a blocking filter on the local linux iptables firewall so it can no longer harass your system. Well I needed something similar on my home Mikrotik router/firewall, but without impacting its performance or doing a lot of scripting. So I put together a quick “3-strike and you are blocked” firewall system using nothing but MIkrotik’s address listing feature.

Here is a complete example of 5 rules that you can place to your firewall rules (you have to understand the rest of your own rules, this is not a complete ruleset!!):

;;; BLACKLIST DROP
add chain=input action=drop in-interface=ether1 \
src-address-list=BLACKLIST  comment="BLACKLIST DROP"

;;; BLACKLIST CANDIDATE 3 - final strike
add chain=input in-interface=ether1 action=add-src-to-address-list \
address-list=BLACKLIST address-list-timeout=2w \
connection-state=new protocol=tcp dst-port=22 src-address-list=BLACKLIST_CANDIDATE_2 \
comment="BBLACKLIST CANDIDATE 3 - final strike "

;;; BLACKLIST CANDIDATE 2
add chain=input in-interface=ether1 action=add-src-to-address-list \
address-list=BLACKLIST_CANDIDATE_2 address-list-timeout=30s connection-state=new \
protocol=tcp dst-port=22 src-address-list=BLACKLIST_CANDIDATE_1 \
comment="BLACKLIST CANDIDATE 2"

;;; BLACKLIST CANDIDATE 1
add chain=input in-interface=ether1 action=add-src-to-address-list \
address-list=BLACKLIST_CANDIDATE_1 address-list-timeout=30s connection-state=new \
protocol=tcp dst-port=22 comment="BLACKLIST CANDIDATE 1"

;;; Allow SSH connections from outside, bude do blacklisting
add chain=input action=accept protocol=tcp in-interface=ether1 dst-port=22 \
comment="Allow SSH connections from outside"

Now let’s go through it with some description, well if you are a little bit firewall friendly, you might have already understood the point, but here is a quick logical explanation.

  1. First rule at the top is a simply block of everything that is in the “BLACKLIST” list, which is empty right now so nothing is happening yet.
  2. Second rule is actually the last strike rule that adds source IPs to BLACKLIST if the IP is already in “BLACKLIST_CANDIDATE_2” list. These candidate lists are a simply way to keep track of which source IPs are already having 1 or 2 strikes. Also notice that source IP is going to BLACKLIST list with timeout of 2 weeks, so it whoever will abuse the SSH will be blocked for 2 weeks on SSH port.
  3. Third rule is an intermediate rule that puts source IPs to candidate list 2 if they are already in candidate list 1 and they make one more SSH conncetion.
  4. Fourth rule is creating first candidate list 1, if a new SSH connection arrives.
  5. Fifth rule is simple allow of SSH access, please note that this rule is not special in any way because the blacklist protection is already done on rule 1 above, so nothing blacklisted will ever arrive here.

NOTE: The overall sequence of these rules is setup in this way so that source IPs are not double-added to any candidate list, that is why the rules seem to be in “reverse” order for a human logic.

Results & summary

If you setup these rules, get some external SSH client and try to open SSH sessions and check address list content after every attempt. On first try you will see your source IP in candidate list 1 like this:

[admin@MikroTik] /ip firewall address-list print
Flags: X - disabled, D - dynamic
 #   LIST                         ADDRESS           TIMEOUTa
 1 D BLACKLIST_CANDIDATE_1        81.4.124.59       29s

After second attempt (you have to make the second attempt in 30seconds after the first one) you will see this:

[admin@MikroTik] /ip firewall address-list print
Flags: X - disabled, D - dynamic
 #   LIST                         ADDRESS           TIMEOUTa
 1 D BLACKLIST_CANDIDATE_1        81.4.124.59       26s
 2 D BLACKLIST_CANDIDATE_2        81.4.124.59       29s

And your last, e.g. third SSH attempt will fail because you will get to BLACKLIST and your TCP session will get starved, and of course your source IP will be on the BLACKLIST

[admin@MikroTik] /ip firewall address-list print
Flags: X - disabled, D - dynamic
 #   LIST                          ADDRESS          TIMEOUTa
 1 D BLACKLIST_CANDIDATE_1         81.4.124.59      20s
 2 D BLACKLIST_CANDIDATE_2         81.4.124.59      22s
 3 D BLACKLIST                     81.4.124.59      1w6d23h59m54s

So in summary, this is a simple, yet powerful protection against SSH bruteforce bots that are trying to access even your home rotuers. The only disadvantage of this system is that it doesn’t differentiate between successful SSH and failed SSH logins, so even if you yourself accidentally open more than 3 sessions under 90 seconds you can get banned, but honestly that is not often the case for connecting to your home router.

HP Networking/Comware NETCONF interface quick tutorial (using python’s ncclient and pyhpecw7)

$
0
0

So let’s learn about NETCONF, but first a bit of history and perspective. Everyone in networking business at least once heard about SNMP (Simple Network Management Protocol), which is the goto protocol for monitoring your network devices, and wondered how cool it would be if you could not only monitor your network with it, but actively configure it (sort of like “SDN wannabe”). But for that purpose the SNMP  was not really useful, it supported some write operations but they were so generic and incomplete that it was not really feasible. That is where NETCONF came around 2011 as a standard (it was here before but its RFC 6241 was ratified then) and changed the game in favor of configuring any device, while not restricting vendors from declaring their own NETCONF data structures to fit their features, but lets first check the protocol first before diving into the data structures.

NETCONF is a RCP (remote procedure call) based protocol, using XML formating as payload and YAML language as data modeling (the part that explains to you what XML to send to configure something).

LAB TOPOLOGY

Ok, lets get to the point, in our excercise I will be focused on the green part of my small lab, so you need at least one comware7 switch and some LLDP neighbors to follow me here. (NOTE: You might even recreate this using the H3C Comware7 simulator, but I haven’t tried that yet for NETCONF)

LAB Topology is simply active comware7 switch with IP management access

Prerequisite here is to have IP communication from your computer to the comware switches, e.g. SSH to either M0/0 interface or any other IP management interface as NETCONF is actually using SSH layer here. I have used M0/0 interfaces configured with IP addresses here.

HOW TO ENABLE NETCONF ON COMWARE7:

Simple, here is a configuration snapshot that actually enables both NETCONF over SSH layer and creates a single user “admin” with password “admin” to access it.

ssh server enable
netconf ssh server enable

local-user admin class manage
 password simple admin
 service-type telnet ssh terminal
 authorization-attribute user-role network-admin

line vty 0 15
 authentication-mode scheme
 user-role network-operator
 idle-timeout 15 0

NOTE: On comware 7 the NETCONF actually listens on TCP port 830 instead of standard SSH port like on e.g. Cisco box. 

PYTHON PREREQUISITES:

I will be assuming that you have python2.7 installed already in the system that you will be using, this can work on both linux and windows, but linux is recommended (run a VM if nothing else). After you have pythin2.7 installed, you need two libraries, one comes simply from python repos using pip command, the second one we simply install from github. Simply follow these commands:

# Install ncclient
pip install ncclient

# Install HPN's pyhpecw7 library
git clone https://github.com/HPENetworking/pyhpecw7.git
cd pyhpecw7
sudo python setup.py install

Test if you have everything working by running python cli interpreter and try to import these libraries to the code like this (no error means install worked!):

[linux-system ~]$ python
Python 2.7.5 (default, Aug  4 2017, 00:39:18) 
[GCC 4.8.5 20150623 (Red Hat 4.8.5-16)] on linux2
Type "help", "copyright", "credits" or "license" for more information.
>>> from pyhpecw7.comware import HPCOM7
>>> import ncclient
>>>

Part I. Exploring the NETCONF data models

Ok, so we enabled netconf, but we have absolutely no idea what to send or expect, so now we will go to the device and dump all the “capabilities” in YAML to read what we actually can and cannot do here.

NOTE ON OPTIONAL SKIPPING OF RAW XML PARTS:  I will give you a choice, you can use ncclient and parse XML to get access to ALL capabilities, or if you want easy life, you can have a look on the pyhpecw7 library documentation only, which makes most of the hard work for you, but it cannot do everything yet.  From my point of view if the python library can support all that you need in your project, you can skip the raw XML sections and look below only on the pyhpecw7 parts.

Step 1.1 Enter XML mode on Comware CLI

To explore the YAML definition, the simplest way is to enter the comware console and type in the “xml” command, which brings you to a special XML/NETCONF mode.

WARNING: I really recommend you try this connected using SSH session so you have option to get out of the console the “hard way” because to get out of the XML mode, you need to enter a special set of xml commands, no CTRL-z / CTRL-c will work here, so there is a chance to get stuck. You have been warned 😉

<AR21-U12-ICB1>xml
<?xml version="1.0" encoding="UTF-8"?><hello xmlns="urn:ietf:params:xml:ns:netconf:base:
1.0"><capabilities><capability>urn:ietf:params:netconf:base:1.0</capability><capability>
urn:ietf:params:netconf:capability:writable-running:1.0</capability><capability>urn:ietf
:params:netconf:capability:notification:1.0</capability><capability>urn:ietf:params:netc
onf:capability:validate:1.0</capability><capability>urn:ietf:params:netconf:capability:i
nterleave:1.0</capability><capability>urn:ietf:params:netconf:capability:rollback-on-err
or:1.0</capability><capability>urn:ietf:params:xml:ns:yang:ietf-netconf-monitoring?modul
e=ietf-netconf-monitoring&amp;revision=2010-10-04</capability><capability>urn:hp:params:
netconf:capability:hp-netconf-ext:1.0</capability><capability>urn:hp:params:netconf:capa
bility:hp-save-point::1.0</capability><capability>urn:hp:params:netconf:capability:not-n
eed-top::1.0</capability><capability>urn:hp:params:netconf:capability:module-specified-n
amespace:1.0</capability><capability>urn:hp:params:netconf:capability:hp-name2index:1.1<
/capability></capabilities><session-id>1</session-id></hello>]]>]]>

You see that you received back a shitload of text, this is an unformatted XML output that you need to “prettify”, I recommend simply opening this XML formating web page in another window and copy&paste the output there, then it looks something like this:

<?xml version="1.0" encoding="UTF-8"?>
<hello
	xmlns="urn:ietf:params:xml:ns:netconf:base:1.0">
	<capabilities>
		<capability>urn:ietf:params:netconf:base:1.0</capability>
		<capability>urn:ietf:params:netconf:capability:writable-running:1.0</capability>
		<capability>urn:ietf:params:netconf:capability:notification:1.0</capability>
		<capability>urn:ietf:params:netconf:capability:validate:1.0</capability>
		<capability>urn:ietf:params:netconf:capability:interleave:1.0</capability>
		<capability>urn:ietf:params:netconf:capability:rollback-on-error:1.0</capability>
		<capability>urn:ietf:params:xml:ns:yang:ietf-netconf-monitoring?module=ietf-netconf-monitoring&amp;revision=2010-10-04</capability>
		<capability>urn:hp:params:netconf:capability:hp-netconf-ext:1.0</capability>
		<capability>urn:hp:params:netconf:capability:hp-save-point::1.0</capability>
		<capability>urn:hp:params:netconf:capability:not-need-top::1.0</capability>
		<capability>urn:hp:params:netconf:capability:module-specified-namespace:1.0</capability>
		<capability>urn:hp:params:netconf:capability:hp-name2index:1.1</capability>
	</capabilities>
	<session-id>1</session-id>
</hello>]]>]]>

This is a list of capabilities that my comware switch (actually a 5940 switch that I used), next we need to pull one of these out.

Step 1.2 Getting a chosen capability YARN definition

As you might realized, the ugly part of this is that you will NOT SEE WHAT YOU TYPE, so just keep copy pasting from this article or from a notepad. Copy&paste this into the XML mode:

COPY&PASTE INPUT:

<hello xmlns="urn:ietf:params:xml:ns:netconf:base:1.0">
<capabilities>
<capability>
urn:ietf:params:netconf:base:1.0
</capability>
</capabilities>
</hello>]]>]]>
<rpc message-id="m-641" xmlns="urn:ietf:params:xml:ns:netconf:base:1.0">
<get>
<filter type='subtree'>
<netconf-state xmlns='urn:ietf:params:xml:ns:yang:ietf-netconf-monitoring'>
<schemas/>
</netconf-state>
</filter>
</get>
</rpc>]]>]]>

OUTPUT:

<?xml version="1.0" encoding="UTF-8"?>
<rpc-reply
	xmlns="urn:ietf:params:xml:ns:netconf:base:1.0" message-id="m-641">
	<data>
		<netconf-state
			xmlns="urn:ietf:params:xml:ns:yang:ietf-netconf-monitoring">
			<schemas>
				<schema>
					.... ~2 ITEMS OMITTED ....
				</schema>
				<schema>
 					<identifier>ietf-netconf</identifier>
					<version>2014-10-12</version>
					<format>yang</format>
					<namespace>urn:ietf:params:xml:ns:netconf:base:1.0</namespace>
					<location>NETCONF</location>				
                                </schema>
				<schema>
                                        .... ~ 30 ITEMS OMITTED ....
				</schema>
			</schemas>
		</netconf-state>
	</data></rpc-reply>]]>]]>

The output here is all the different YANG files describing different aspects of configuration that you might be interested in, so lets pick the one identifier “ietf-netconf” above and lets download it YANG schema.

<identifier>ietf-netconf</identifier>
<version>2014-10-12</version>
<format>yang</format>
<namespace>urn:ietf:params:xml:ns:netconf:base:1.0</namespace>
<location>NETCONF</location>

Take the identifier and add it to this XML template :

<rpc message-id=”101″ xmlns=”urn:ietf:params:xml:ns:netconf:base:1.0″>
<get-schema xmlns=’urn:ietf:params:xml:ns:yang:ietf-netconf-monitoring’>
<identifier>ietf-netconf</identifier>
<version>2014-10-12</version>
<format>yang</format>
</get-schema>
</rpc>]]>]]>

And use the create XML as another COPY&PASTE input. This will give you a YANG definition of the schema to the console, so make sure you are capturing text from terminal to a file because this is going to be a very large output once you copy&paste the above.

Part 1.3 Exiting the XML session in CLI

Since traditional CTRL-c is not working, you actually have to exit using this XML as input:

<rpc message-id="101" xmlns="urn:ietf:params:xml:ns:netconf:base:1.0">
<close-session/>
</rpc>]]>]]>

Part II – Using python ncclient to control netconf

Ok, lets now assume you skipped the Part I because, well lets say because you hate XML parsing in text strings (like I do), how would you jump right into using an XML/NETCONF client with HPN Comware without knowing the YANG files … well it is actually not that hard, you can start by listing the whole running configuration (e.g. the NETCONF view on “display current-configuraiton”) by running a python’s ncclient.

Step 2.1 Starting a python CLI interpreter and importing needed libraries

if you get error on anything here, just install xml and ncclient libraries using pip.

[user@linux-host ~]$ python
Python 2.7.5 (default, Aug  4 2017, 00:39:18) 
[GCC 4.8.5 20150623 (Red Hat 4.8.5-16)] on linux2
Type "help", "copyright", "credits" or "license" for more information.
>>> from ncclient import manager
>>> import xml.dom.minidom

Step 2.2 downloading NETCONFs complete data view

We are still in the python CLI from previous step, and we enter the following lines ( of course update the hostname / username / password to match your LAB! ) :

with manager.connect(host='AR21-U12-ICB1',
                      port=830,
                      username='admin',
                      password='admin',
                      hostkey_verify=False,
                      allow_agent=False,   
                      look_for_keys=False  
                      ) as netconf_manager:
  filter = '''
                <top xmlns="http://www.hp.com/netconf/data:1.0">
                </top>
               '''
  data = netconf_manager.get(('subtree', filter))

now you should have some data variable full of XML text string, but not really nice, if you do print data, you will not be able to read it in a “human” way, so lets instead print it like this:

xmlstr = xml.dom.minidom.parseString(str(data))
pretty_xml_as_string = xmlstr.toprettyxml()
print pretty_xml_as_string;

The output printed should be something like this will be more than 50,000 lines (yes, 50k lines!), so feel free to only have a look on this as a txt file here.

NOTE: This is a complete BRAIN-DUMP of a switch, if you investigate this file, you will see details starting from simple as hostname to details like interface and cpu counters! So this is a great source of troubleshooting and if you figure-out what data you are interested in long term with a more detailed filter.

Step 2.3 filtering parts of interest (VLAN view only here)

You do not want to always download everything, so lets try to for example filter VLANs like this
(complete script file this time):

#!/bin/python

from ncclient import manager
import xml.dom.minidom
from pprint import pprint

##################################### 
# STEP 2.3 script, get all VLANs info
#####################################

with manager.connect(host='AR21-U12-ICB1',
                      port=830,
                      username='admin',
                      password='admin',
                      hostkey_verify=False,
                      allow_agent=False,   
                      look_for_keys=False  
                      ) as netconf_manager:
  vlans_filter = '''
                  <top xmlns="http://www.hp.com/netconf/data:1.0">
                          <VLAN>
                              <VLANs>
                              </VLANs>
                          </VLAN>
                  </top>
                 '''
  data = netconf_manager.get(('subtree', vlans_filter))

# Pretty print
xmlstr = xml.dom.minidom.parseString(str(data))
pretty_xml_as_string = xmlstr.toprettyxml()
print pretty_xml_as_string;

The output of this will be something like this because I only have VLAN 1 and VLAN 600 in my system:

<?xml version="1.0" ?>
<nc:rpc-reply message-id="urn:uuid:397858b2-379d-49a6-9257-4d6183600926" xmlns:nc="urn:ietf:params:xml:ns:netconf:base:1.0">
        <nc:data>
                <top xmlns="http://www.hp.com/netconf/data:1.0">
                        <VLAN>
                                <VLANs>
                                        <VLANID>
                                                <ID>1</ID>
                                                <Description>VLAN 0001</Description>
                                                <Name>VLAN 0001</Name>
                                                <UntaggedPortList>1-21,25,29,37-44</UntaggedPortList>
                                        </VLANID>
                                        <VLANID>
                                                <ID>600</ID>
                                                <Description>VLAN 0600</Description>
                                                <Name>VLAN 0600</Name>
                                                <TaggedPortList>1-20</TaggedPortList>
                                        </VLANID>
                                </VLANs>
                        </VLAN>
                </top>
        </nc:data>
</nc:rpc-reply>

Step 2.4 Creating new VLAN using NETCONF and ncclient

Now, lets switch from downloading data to changing something, lets create a new VLAN here, we simply change the filter to contain the VLAN structure that we would like to see like this:

#!/bin/python

from ncclient import manager
import xml.dom.minidom
from pprint import pprint

########################## 
# STEP 2.4 Create VLAN 999
##########################

with manager.connect(host='AR21-U12-ICB1',
                      port=830,
                      username='admin',
                      password='admin',
                      hostkey_verify=False,
                      allow_agent=False,   
                      look_for_keys=False  
                      ) as netconf_manager:
  vlans_change_filter = '''
                  <config xmlns="urn:ietf:params:xml:ns:netconf:base:1.0">
                     <top xmlns="http://www.hp.com/netconf/config:1.0">
                          <VLAN>
                              <VLANs>
                                <VLANID>
                                  <ID>999</ID>
                                  <Description>VLAN 0999</Description>
                                  <Name>TestingVLAN999</Name>
                                </VLANID>
                              </VLANs>
                          </VLAN>
                    </top>
                  </config>
                 '''
  data = netconf_manager.edit_config(target='running',config=vlans_change_filter,default_operation='replace');

# Pretty print
xmlstr = xml.dom.minidom.parseString(str(data))
pretty_xml_as_string = xmlstr.toprettyxml()
print pretty_xml_as_string;

The result this time will be a simple OK via XML like this:

<?xml version="1.0" ?>
<nc:rpc-reply message-id="urn:uuid:7596374d-2dae-411e-b8c1-e3b4e9a51254" xmlns:nc="urn:ietf:params:xml:ns:netconf:base:1.0">
        <nc:ok/>
</nc:rpc-reply>

Additionally a quick check on the switch shows that vlan 999 started existing afterwards:

[AR21-U12-ICB1]disp vlan 999
This VLAN does not exist.
[AR21-U12-ICB1]disp vlan 999
 VLAN ID: 999
 VLAN type: Static
 Route interface: Not configured
 Description: VLAN 0999
 Name: TestingVLAN999
 Tagged ports:   None            
 Untagged ports: None

Part III. Using PyHPEcw7 library to avoid XML parsing

The great thing about PyHPEcw7, github linke here, is that it hides all the XML text parsing away from you and gives you python objects to play with. As mentioned above, the INSTALL is simply:

# Install HPN's pyhpecw7 library
git clone https://github.com/HPENetworking/pyhpecw7.git
cd pyhpecw7
sudo python setup.py install

Afterwards you should be able to import the appropriate libraries in your code, try it in the python CLI interpreter.

[user@linux-host ~]$ python
Python 2.7.5 (default, Aug  4 2017, 00:39:18) 
[GCC 4.8.5 20150623 (Red Hat 4.8.5-16)] on linux2
Type "help", "copyright", "credits" or "license" for more information.
>>> from pyhpecw7.comware import HPCOM7
>>>

No error means that it works for you 🙂

Step 3.1 Connecting to your comware switch using PyHPEcw7

This is a straightforward procedure with a nice IF test afterwards to know if you are or aren’t connected.

#!/bin/python
from pyhpecw7.comware import HPCOM7

# Change this to match your switch
args = dict(host='AR21-U12-ICB1', username='admin', password='admin', port=830)

# CREATE CONNECTION
device = HPCOM7(**args)
device.open()

# Check if connected
if not device.connected:
  print("Unable to connect to target switch, exiting ... ")
  quit(1)

Step 3.2 Getting list of VLANs

To save a little space, I am going to follow using python CLI interpreter “as if” after the connection example in step 3.1, so if you are building a python script file, put these lines after the step 3.1 example.

vlan = Vlan(device, '')
vlans = vlan.get_vlan_list()
pprint.pprint(vlans)

And the result will be a list of vlans that comes from the NETCONF Interface like this:

['1', '600']

Step 3.3 Create new VLAN

Simple, create a new Vlan python object with needed parameters and have it “built()”, it will automagically appear on the comware switch.

# configure a vlan 777
vlan = Vlan(device, '777')
args = dict(name='NEW 777', descr='DESCRiption 777')
vlan.build(**args)

From the switch:

[AR21-U12-ICB1]display vlan 777
 VLAN ID: 777
 VLAN type: Static
 Route interface: Not configured
 Description: DESCRiption 777
 Name: NEWV 777
 Tagged ports: None           
 Untagged ports: None

Step 3.4 Find and remove specific VLAN

Ok, we can list all, create now lets try deleting a VLAN. The variation here is that we simply find the VLAN using a number using Vlan object constructor and then run .remove method on it.

NOTE: You might now realized that I haven’t presented deleting a VLAN using native XML/ncclient in part 2, the reason is that doing this via XML is kind of problematic (or at least I found it), I either had problems doing it directly and I had to go into NETCONFs stage/commit system, which requires you taking whole configuration, doing delta changes and resubmit it all back. I honestly disliked this approach very much and decided to drop deletion part from direct XML/nclicent parts. If you really want to see this, go and have a look on the code of PyHPEcw7 how it is doing this on their github.

# Find and remove a vlan
vlan = Vlan(device, '777')

# Print found VLAN details
print("VLAN object before deletion:")
pprint.pprint(vlan.get_config())

# Remove the vlan
vlan.remove()

# Print the VLAN again to see it is deleted
print("VLAN object after deletion:")
pprint.pprint(vlan.get_config())

OUTPUT:

VLAN object before deletion:
{'descr': 'DESCRiption 777', 'name': 'NEW 777', 'vlanid': '777'}

VLAN object after deletion:
{}

Part IV. BONUS: Help, what I need to do is not part of PyHPEcw7!

Ok, this is a real problem that I actually faced trying to work with this library. For my particular problem I was in need to do some Interfaces changes, but the only way how to work with Interfaces in PyHPEcw7 is to know the interface names in advance (ergo there is no “get all interface names as list” method there) and your way to get Interface as object is something like this (using python CLI here with “device” already connected switch):

>>> from pyhpecw7.features.interface import Interface
>>> interfaceObj = Interface(device,"")              
>>> interfaceObj.get_config()
{'admin': 'up', 'duplex': 'auto', 'speed': 'auto', 'description': 'TwentyGigE1/0/1 Interface', 'type': 'bridged'}

So how to get a list of Interfaces, well I had to do a little reverse engineering of the library and I this library is actually having a nice set of XML helper functions that if you know at least a little bit about NETCONF XML structure it can help you as well (because in background it is using ncclient anyway). So armed with the power of what you learned here in ALL sections, you too should be able to construct something like this using their middleware library pyhpecw7.utils.xml.lib.

Here is a code to get all Interfaces as list of Interfaces objects using XML parsing using parts of PyHPEcw7:

@staticmethod
def getInterfaces(device):
  from pyhpecw7.utils.xml.lib import *
  from pyhpecw7.features.interface import Interface
  E = data_element_maker()
  top = E.top(
      E.Ifmgr(
          E.Interfaces(
            E.Interface(
            )
          )
      )
  )
  nc_get_reply = device.get(('subtree', top))

  # Gets an array of interface names from XML  
  reply_data_names = findall_in_data('Name', nc_get_reply.data_ele)

  # Constructs interfaces list for reply using only interfaces names
  interfaces = []
  for ifname in reply_data_names:
      interfaces.append(Interface(device,ifname.text))

  return interfaces

Summary

So we went via NETCONF using very raw and direct examples directly in switch CLI, then went via NETCONF client called ncclient (in python) and finally went through basic examples how to have a bit easier life using HP Networking’s PyHPEcw7 library in python to do all the XML work for you more easily. If you absorbed all in this tutorial I am actually proud of you as it took me quite some time to put all this together from various sources. So as always, stay tuned where this rabbit hole leads ….

UPDATE: Follow-up article on using NETCONF in Network Visuzalization

Actually a spoiler here is that as a follow-up on the NETCONF, here us a small article describing an idea how to visualize network topology using information gathered from NETCONF using python. Maybe this will finally get rid of at least partial manual visio map creations…. probably not yet, but one can dream! See here.


Viewing all 23 articles
Browse latest View live