After a longer break, I managed to get back to my small visualization experiment from last time, and improve it a little. Firstly, the NETCONF interface was switched for a more standard SNMP one, even if that is not as cutting edge anymore.
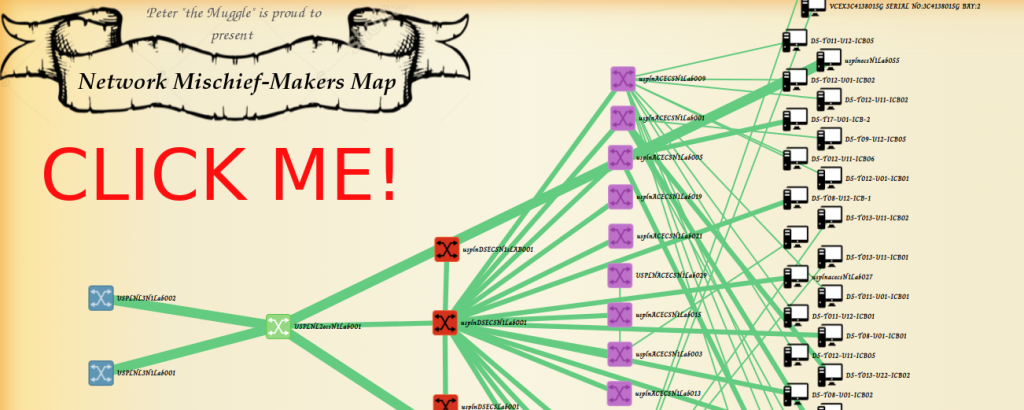
So without keeping you waiting, here is firs the visualization example, as you can see I was playing here a little and got inspired by the Mischief-makers map from Harry Potter. Of course if you do not like the visuals just re-do the CSS to get rid of it.
Also, this time I made the code public using the much more common github.com here.
Usage/Tutorial
Once you download this project from github, you will find several files in the directory, your starting point are the two configuration files called:
- config.ini – holds SNMP configuration like community string and a list of IPs for each network device to be SNMP queried
- pyconfig.py – holds low level configuration on how to visualize the data recieved and how to order the devices detected into layers
Lets start with the config.ini, which is much smaller. Here is an example.
[DEFAULT]
SnmpVersion = 2c
SnmpCommunityString = devpassword
LogFile = Logs/NetworkMapper.log
Debug = yes

[DEVICES]
devices = [
     "192.168.56.200",
     "192.168.56.201",
     "192.168.56.202"
     ]
As you can see, you need to list devices using their IPs and snmp community string.
Secondly, you have the pyconfig.py, which is a python data file that controls what happens with the data received from the SNMP. Practically speaking, we use naming recursive patterns to classify the devices to a group, which is practically a layer in where that devices should appear in the map.
We also have a few definitions, but the important part is the parameter called MAX_STATS_RECORDS, which holds information on how many traffic counter readings to hold.
# TABLE ROW DEFINITIONS
sysName_named_oid = [('SNMPv2-MIB', 'sysName', 0)]

interfaces_table_named_oid = [
    ('IF-MIB', 'ifDescr'),
    ('IF-MIB', 'ifType'),
    ('IF-MIB', 'ifMtu'),
    ('IF-MIB', 'ifSpeed'),
    ('IF-MIB', 'ifPhysAddress'),
    ('IF-MIB', 'ifAdminStatus'),
    ('IF-MIB', 'ifOperStatus'),
    ('IF-MIB', 'ifHCInOctets'),
    ('IF-MIB', 'ifHCOutOctets'),
    ('IF-MIB', 'ifHighSpeed')
]

lldp_table_named_oid = [
    ('LLDP-MIB', 'lldpRemSysName'),
    ('LLDP-MIB', 'lldpRemSysDesc'),
    ('LLDP-MIB', 'lldpRemPortId'),
    ('LLDP-MIB', 'lldpRemPortDesc')
]

lldp_local_port_name = [('LLDP-MIB', 'lldpLocPortId', 0)]

#######
#STATS
#######
MAX_STATS_RECORDS = 2016

#########################################################
# REGULAR EXPLRESSIONS FOR MATCHING PORT NAMES TO SPEEDS
# NOTE: This is used in visuzation later to color lines
#########################################################
LINK_SPEEDS = [("^TwentyGigE*", "20"),
               ("^FortyGig*", "40"),
               ("^Ten-GigabitEthernet*", "10"),
               ("^GigabitEthernet*", "1")]

#########################################################
# REGULAR EXPLRESSIONS FOR MATCHING DEVICES HIERARHY
# E.g. Access layer switches have "AC" in their name
# or aggregation layer devices have "AG" in their names
#########################################################
NODE_HIERARCHY = [
                  ('^[a-zA-Z]{5}L2.*', "4", "L2.png"),
                  ('^[a-zA-Z]{5}L3.*', "5", "L3.png"),
                  ('^[a-zA-Z]{5}DS.*', "3", "DS.png"),
                  ('^[a-zA-Z]{5}AC.*', "2", "AC.png")
                  ]

IGNORED_IFTYPES = [ "l3ipvlan", "softwareLoopback", "other"]
In summary these files are quite self explanatory, but of course some experimentation is expected on your side.
Running the program
When you have everything configured, your task is to execute the python file network_mapper.py periodically, this creates the map, but also gathers counters on all interfaces it detects. Depending on the size of the network and how much granularity you need on interface stats, I recommend somewhere between 5 and 30 minutes.
I recommend experimenting first using direct python execution, e.g.
$ python3 network_mapper.py
and afterwards put it to cron scheduled for the periodic execution.
The results and new GUI features
Every run of the program creates a visualized topology in directory /html that is identical with the example shown above. You should move these results under some web servers documents root and you are finished. As you realize I have added the funny “Mischief-Makes Map” theme, but if you edit the css files inside the results directory, it should be simple to drop this in favor of a more serious theme.
In regards to the new features, there are several.
Navigation and zoom
It was really hard to do a SWG diagram zoon, so bear with me. To achieve something like this there is a giant javascript that is doing x,y coordinates translation calculations and do not get me started on the zoom at all :). In summary it works and it is now good enough for larger topologies, that have a tendency to be out of a single screen.
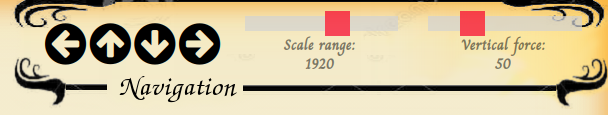
Also check the vertical force slider, that is really fun to play with 
Interface statistics
We have two types here, first is similar to good old MRTG, in that it aggregates interface stats to a detailed graph, see below.
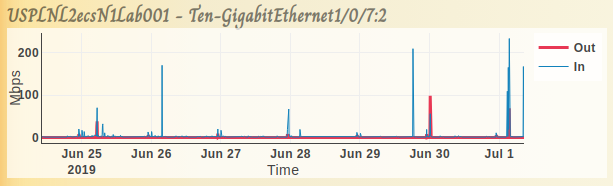
You can get this by either clicking on a node and selecting interface stats from a drop down, or clicking on any link directly.
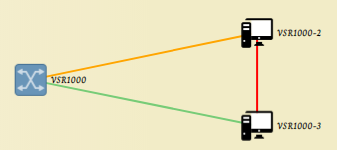
Additionally, in the graph itself, you can have links of three colors, green when utilization below 50%, orange when utilization between 50-75% and red if utilization above 75%. This is great to identify where in the topology you have a bottleneck.
Here is a quick example done manually, since I right now do not have any lab topology with fully burned links.
Summary
Not much to say really, this is an incremental update, which unfortunately took me a year to do because of the SWG manipulations and traffic statistics with adequate performance (both in collection and GUI), but it works!
You can get it yourself on my github.com here. Just remember, keep this open source and referencing me as original author and I am all fine with anyone using this. Hope you enjoy it.